Trading the Energy Market
What you need to know

Think of it as sweet revenge. The fuel that costs so much at the filling station can also be a source of income if you know how to trade crude oil on the open market. Or consider this – the natural gas that can be a devil to your company’s budget can, to a large extent, be tamed if you know how to hedge it.
Trading and hedging are rarely taught in mainstream economics or business classes, and even courses that focus on these activities seldom cover the energy markets in detail. But if you have the right tools and a deeper understanding of what makes the market tick, energy commodities can become significantly more approachable – even profitable.
What follows is a beginner’s roadmap to trading energy. For those with trading experience, it is also designed as a tool kit – a checkoff list, if you will – to confirm that you’re covering the essentials and optimizing your trades. It will not guarantee success, of course. Nothing can. But it will help ensure that you are giving yourself the best chance to thrive in a market that can be as rewarding as it is difficult.
So, let’s start with the basics.
What energy commodities are readily tradable?
By readily tradable, we mean those products that be traded on a laptop or cell phone through commonly accessible brokerages. The five main commodities are as follows:
- Crude oil
Two major crude oils are widely traded and serve as industry benchmarks. West Texas Intermediate oil, or WTI, is traded on the New York Mercantile Exchange (NYMEX). Brent oil, whose price represents a blend of crude oils from the North Sea, is traded on the Intercontinental Exchange (ICE). - Gasoline (petrol, outside the Western Hemisphere)
A major gasoline product is RBOB, for Reformulated Gasoline Blendstock for Oxygenate Blending. It is traded on the New York Mercantile Exchange (NYMEX). - Heating Oil
NY Harbor heating oil, also referred to as Ultra Low Sulfur Diesel (ULSD), is the benchmark for home heating oil and diesel fuel in the US. It is traded on NYMEX. - Gasoil
Gasoil is the benchmark low-sulfur fuel in the UK and the EU. Used in tandem with ULSD for arbitrage trades of diesel, it is traded on ICE. - Natural gas
The natural gas mostly traded is sourced out of the Henry Hub pipeline nexus in Louisiana and traded on NYMEX.
What other types of tradeable commodities are there?
There are any number of petroleum derivatives that are bought and sold on exchanges or privately between buyers and sellers. These include fuel for jets, plastic products, and combinations of plastic products, such as polypropylene and polyethylene.
While not a commodity per se, industrial emissions represent a significant emerging market. In those areas where an emissions trading program is in operation, industrial concerns and energy producers can purchase credits to meet emission regulations. Alternatively, manufacturers and producers who come in below their emission allowances can sell the excess allowances as credits. Institutional hedge funds also trade these markets, but trading them requires the assistance of experienced professionals to gain access.
Several countries that have established emissions trading markets include Australia, India, Japan, South Korea, and the UK. The largest such market is in China (established 2021), and the largest multi- national market operates in the European Union (established 2005).
The US has no national program, but several active markets have been launched on a statewide or regional basis. The Regional Greenhouse Gas Initiative (RGGI) was established in 2009 and includes nine northeastern states. In 2013, California initiated its greenhouse gas cap-and-trade program.
As the names of many of these markets imply, they lend themselves more toward risk management than speculation. Such programs can also help corporations meet environmental, social and governance (ESG) goals.
What financial instruments are available for trading energy commodities?
The most common trading instruments are futures, options, CFDs, and equity shares. There are many other trading instruments, such as debt obligations, swaps, and forwards, but these tend to be transacted privately between buyers and sellers. Our aim here is to cover the instruments that are widely traded on exchanges and readily accessed through brokerages.
All of the more common instruments can be bought or sold. Thus, a trader can buy (“long”) a share of an oil producing company, such as Chevron, with the aim of selling it at a higher price. Alternatively, she can sell (“short”) the same stock without owning it (essentially borrow it) with the aim of buying it back at a lower price and profiting from the difference. After the trader buys back her shorted asset, she is no longer tied to it legally or financially.
Futures – A future is a contract that entitles the owner to purchase an asset at a fixed price on a later date. Because futures are leveraged, you can control a much larger underlying asset with a relatively small deposit, known as the initial margin requirement. For example, a single crude oil future contract controls 1,000 barrels of oil, and if oil is selling for $100 per barrel, the total (notional) value of the contract would be $100,000. However, you can buy or sell oil futures at the per-barrel market price ($100 in this case) if you have sufficient margin in your trading account.
Exchanges typically require a margin of 10-12% of the notional value. So, still using this example, for every $10,000-$12,000 of cash you have in your account, you can trade a single contract. (Some brokerages require larger margins, depending on the client and the volatility of the market.) Your profit or loss for each contract would equal the price change multiplied by 1,000 (the number of barrels) at the time you close the trade.
So, if WTI goes up 10 cents on your purchased contract, your gain would be 10 cents x 1,000 = $100. If the price moves against you, you will lose by the same proportional amount. If it goes against you substantially, you will be asked by the brokerage to post additional margin or close the trade at a loss. For those who need to take delivery of the oil, the overall cost will remain $100,000, plus nominal brokerage fees, regardless of the price of oil at the contract’s expiration date.
Options – There are two basic types of options: one that gives the owner the right but not the obligation to buy an asset at a specific price (known as a “call”), and one that gives the owner the right but not the obligation to sell an asset at a specific price (known as a “put”). Each option controls a hundred shares of the underlying asset. So, for example, if a trader buys a call to purchase BP at $35, she can purchase a hundred shares of BP for $35 no matter how much the share price goes up, as long as the option has not expired. Alternatively, she can sell the option itself, which rises or falls with the share price but generally at a greater amount, depending on the proximity to expiration and other factors.
Options can also be shorted, but such trades entail sizeable risk if the trader does not also own the underlying asset. Say, for instance, you sell a call for Chevron that is tied to a listed price (“strike price”) of $100 per share. And let’s assume, for simplicity’s sake, that Chevron shares are currently selling at that price. Then let’s assume Chevron goes up 50% from $100 to $150 a share. You would be liable for the difference between the current share price and the strike price, or $5,000 ($50 x 100 shares), minus the profit you made on the original sale, which was probably a couple hundred dollars.
On the plus side, some 90% of shorted options expire below the share price (“out of the money”), so traders willing to take the risk can make substantial gains.
CFDs – A CFD is a financial instrument that enables you to speculate on the price movement of an asset, such as a stock or commodity, without buying the asset. Instead, you buy a contract for difference at a fraction of the cost. When you sell the contract at a time of your choosing, the difference between the asset price when you bought the CFD and the price when you sell it represents your gain or loss, after factoring in the nominal cost of the CFD itself. CFDs are illegal in the US because they are not executed through regulated exchanges.
Equity shares – Unlike options and futures, equity shares are not limited by expiration dates. They can be held indefinitely, even passed down to future generations. Moreover, their value can be hedged using options. Say, for example, you buy 100 shares of a natural gas distributor for $50 per share. You can protect your investment for a fraction of the share price by purchasing a put with a strike price of $50. Until the put expires, you can sell your shares for $50, even if the firm’s valuation plummets dramatically. Futures contracts can also be hedged using options.
How does an experienced trader analyze markets?
There are two basic ways of analyzing markets. While experienced traders tend to veer toward one or the other, most successful traders pay attention to both.
- Fundamental analysis focuses on economic and financial factors that shape markets. These factors range from a macro perspective that considers the health of the world economy and the political climate, to a micro perspective that zeroes in on specific supply-and-demand issues affecting an individual sector.
- Technical analysis begins and ends with what is visible on the price charts. It uses price movement, price patterns and the volume of trades, among other dynamics, to understand the nature of a market and anticipate its moves.
Why do I need both fundamental and technical analysis?
Events, especially major ones, have a way of remaking markets, sometimes overnight. After Russia invaded Ukraine, any technical analysis that characterized the direction of oil, natural gas, and wheat markets was all but invalidated. That, of course, is an extreme example, but even slower-developing forces, such as inflation, can creep up suddenly and last longer than expected, swaying commodity prices.
On the technical side, paying attention to chart patterns and time-proven indicators can render seemingly random acts of buying and selling into identifiable signs of trends, momentum, and market reversals. Such knowledge is all but essential in today’s market, where up to 75% of trading is executed by computers, which feed price patterns into their models.
Using both fundamental and technical analysis can act as a sort of gas and brake pedal, depending on which one you favor. If, say, an oil company is showing an upward trend on the charts, but the firm suffers a major pipeline incident, this fundamental input should temper the technical ones.
What fundamental inputs specifically shape the energy market?
Basic macro forces, such as supply and demand (S&D), shape all markets. But energy commodities have their own specific drivers.
Oil, for example, is especially price sensitive to supply. We’ve seen this phenomenon again and again when OPEC widens or narrows their spigots. In addition to supply levels, there are other, downstream factors that can also influence price. Most of these factors are detailed in periodic reports that are available to the public.
One such report is the US Energy Information Administration (EIA) inventory issued every Wednesday (Thursday if there is a holiday Monday) available at https://www.eia.gov/petroleum. The other is a count of the working rigs in the US, Canada, and the world, issued on Fridays by Baker Hughes, an American oil fields services company, available at https://bakerhughesrigcount.gcs-web.com.
On the demand side, oil is largely driven by the use of derivatives, such as gasoline and diesel. If an increase in driving is anticipated, for example, it will put upward pressure on prices. The EIA also releases outlooks on energy uses at https://www.eia.gov/outlooks/steo. The US Department of Energy (DOE) is another good source for energy usage, as is the new Market Intelligence interactive reports generator on the StoneX web site (https://my.stonex.com).
Natural gas prices, like oil, are largely determined by inventory. But unlike oil, weather plays a much larger role concerning demand, particularly during winter, when residential use skyrockets. Accordingly, long-term weather reports are key to trading the commodity.
Natural gas prices are also driven by the health of the manufacturing sector, due to the many industrial uses of this commodity. Here, a number of monthly government and industry reports can provide insight, such as the report published by the Institute for Supply Management Purchasing Managers Index (ISM PMI) available at https://www.ismworld.org, or the Philly Fed Manufacturing Index released by the Federal Reserve Bank of Philadelphia, available at https://www.philadelphiafed.org.
In understanding energy commodities, the main thing to remember is that each and every one is a physical product. Unlike high-tech, software, or consumer markets, which can be influenced by customer preference, shifting supply lines and product inventiveness, energy is a basic staple with established delivery points. Consequently, the market is largely shaped by supply and demand.
Granted, the concentrated push toward renewables is slowly but steadily altering the S&D equation. But in the short term, as we transition to greener energy, the demands on the legacy systems are forecast to increase substantially.
What are some useful technical indicators?
There are literally hundreds of technical indicators. Some traders swear by them. Some swear at them. Some do both. But it should be borne in mind that each and every one is a trailing indicator.
In other words, each is a snapshot of data points leading up to the present moment. They cannot predict the future. They can only accentuate the trends and momentum that drove prices to where they are now.
Still, indicators have their uses. They can reveal price levels that are acting as ceilings (resistance) or foundations (support). They can suggest trade entry and exit points. And they can support hunches of where the market is going, especially when corroborated by other indicators.
Below we describe some of the more popular ones using WTI charts from the past couple of years. These and many other well-known indicators can be applied to your charts with a few simple mouse clicks on most trading platforms.
Exponential Moving Average (EMA)
Source: StoneX Market Intelligence
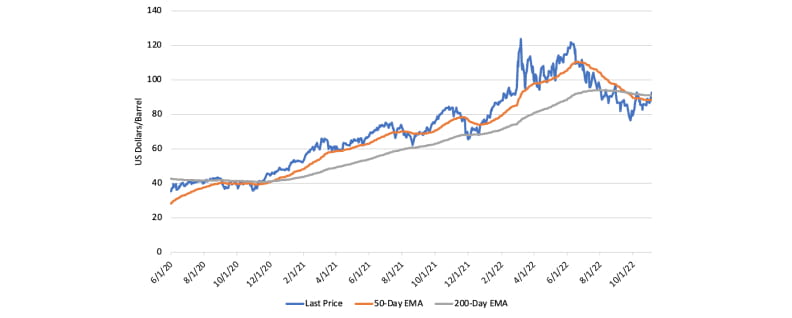
A moving average smooths out the normal jaggedness of price charts by drawing trend lines of price averages. An exponential moving average gives more weight to the latest data points. Above, the chart shows price averages during a 200-day and 50-day period. Both have been trending up of late in this chart, but what is of particular significance is that the short-term average has crossed over the long-term average (circle), indicating upward momentum. In trader lingo, that’s a “buy signal”.
Support and Resistance (S&R)
Source: StoneX Market Intelligence
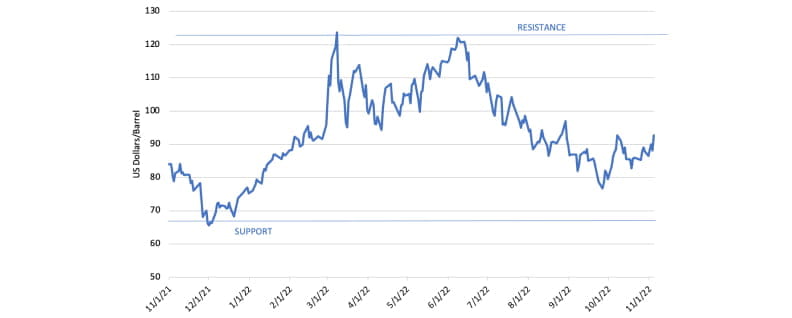
As noted in the beginning of this section, sometimes a price level acts as a barrier to the upside (resistance) or to the downside (support). And sometimes, as in the example above, both support and resistance are active, keeping the price bound within a range. When an asset breaks through resistance and stays above it (green arrow), that’s another buy signal.
Stochastic Oscillator
Source: StoneX Market Intelligence
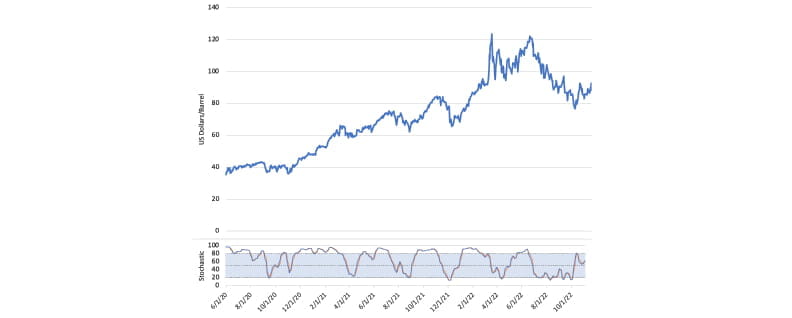
The stochastic oscillator indicates momentum by comparing closing prices to a range of prices within two time frames, such as 7-day and 14-day periods. When the line representing the shorter time frame crosses above the line representing the longer one, the momentum is to the buy side – especially when the shorter line stays above the longer one for an extended period. Momentum is to the sell side when the short line crosses down under the long. The stochastic can also show when an asset is overbought (the lines are above 90%) or oversold (the lines are below 10%). The overbought and oversold lines can be customized to, say, 80% and 20%. Some traders have no qualms about trading overbought or oversold assets, as stochastics can stay at these levels for a while.
Relative Strength Index (RSI)
Source: StoneX Market Intelligence
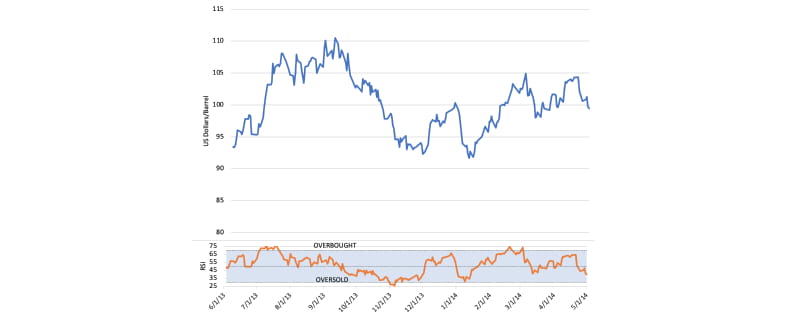
Like the stochastic, the RSI measures momentum. It uses a formula that compares the volume and range of an asset price on positive days to those factors on negative days. If the RSI is above 70%, the asset is considered overbought. If it is below 30%, it is considered oversold. Crossing the overbought or oversold line is seen as a signal to sell or buy, respectively. The RSI is purported to be more accurate in range-bound markets than in trending ones.
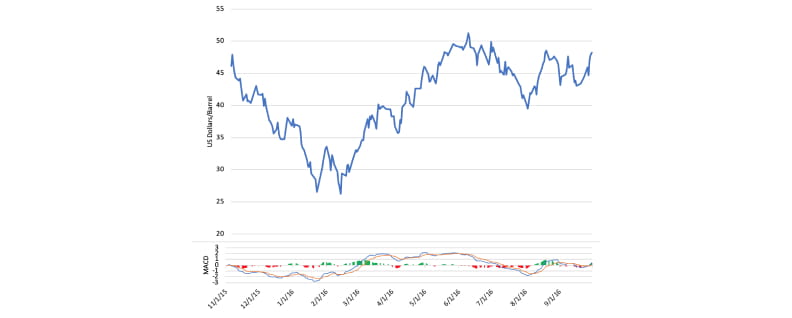
Moving Average Convergence Divergence (MACD)
Source: StoneX Market Intelligence
The MACD tracks the relationship between two exponential moving averages that are based on different time frames, such as 12-day and 26-day periods. The lines at the bottom of the chart represent the EMAs. The red and green columns show the price differences between them (plus or minus) on any given day (this being a daily chart). The MACD is intended to show where a trend is gaining momentum. When the shorter period EMA crosses above the longer period EMA, the indicator is giving a buy signal. And vice versa when the short line crosses down. The distance of the EMA lines above or below the mid-point of the columns (indicated by a faint line), shows the relative strength of upward or downward momentum, respectively.
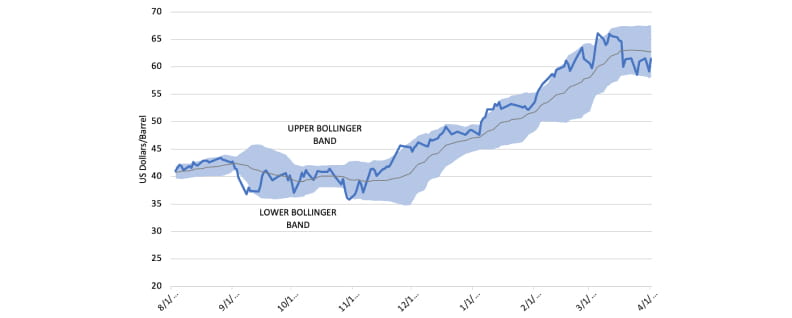
Bollinger Bands
Source: StoneX Market Intelligence
Bollinger Bands are built around a simple moving average, commonly for a 20-day period, which forms a central line. Then the upper and lower bands are formed by adding and subtracting two standard deviations from the moving average. If price breaks below the lower band, as in November 2020 in the chart above, it indicates an oversold condition in which the asset is likely to reverse. If price breaks above the upper band, it indicates an overbought condition, as shown in March 2021.
Bollinger bands often work better in range-bound markets. In strongly trending markets, they tend to give premature buy and sell signals. The width of the bands indicates volatility
Conclusion – Applying the Tools
In trading, as in other professions, tools are meant to make a job easier. And while some of these tools may seem difficult to absorb, they’ll feel like old friends after even a relatively short period of use. Also, as in other professions, experience is the best teacher, and trading becomes more manageable after you’ve been in the game a while. To be sure, the complexity of the energy market in a world undergoing major political and economic transformation can be daunting. Brayton Tom, Head of the OTC Risk Desk for StoneX in New York, noted recently that today’s market is one of the strangest he has ever seen in his 18 years of trading and hedging energy commodities. “There is something new every day that dictates and changes price direction,” he stated. “Sometimes it just doesn’t make sense, until we dig deeper.”
Tom suggested that the best way to approach the energy market is to look inward first. “Determine what your business risks are and how you want to manage that risk. And above all else, determine your risk tolerance.” Risk management, of course, can be both active and passive. You might be tempted to stand on the sidelines while prices shoot up or down, but that can be even more costly than actively making trades and hedges with mixed results. In the final analysis, regardless of how you manage risk, having a basic knowledge of fundamental market drivers and technical indicators will almost certainly raise your success level. And if circumstances require you to call in the cavalry (i.e., a consultant) to work out the thornier issues, you’ll still have a clearer grasp of what the consultant is proposing, as well as a deeper understanding of your trading and hedging requirements going forward.
The trading of derivatives such as futures, options, and over-the-counter (“OTC”) products or “swaps” may not be suitable for all investors. Derivatives trading involves substantial risk of loss, and you should fully understand those risks prior to trading. Past financial results are not necessarily indicative of future performance. All references to futures and options on futures trading are made solely on behalf of the FCM Division of StoneX Financial Inc., a member of the National Futures Association (“NFA”) and registered with the U.S. Commodity Futures Trading Commission (“CFTC”) as a futures commission merchant. All references to and discussion of OTC products or swaps are made solely on behalf of StoneX Markets LLC (“SXM”), a member of the NFA and provisionally registered with the CFTC as a swap dealer. SXM’s products are designed only for individuals or firms who qualify under CFTC rules as an ‘Eligible Contract Participant’ (“ECP”) and who have been accepted as customers of SXM.
This material should be construed as the solicitation of trading strategies and/or services provided by the FCM Division of StoneX Financial Inc., or SXM, as noted in this presentation.
Neither the FCM Division of StoneX Financial Inc. nor SXM is responsible for any redistribution of this material by third parties, or any trading decisions taken by persons not intended to view this material. Information contained herein was obtained from sources believed to be reliable, but is not guaranteed. These materials represent the opinions and viewpoints of the author, and do not necessarily reflect the opinions or viewpoints of the FCM Division of StoneX Financial Inc. or SXM.
All forecasting statements made within this material represent the opinions of the author unless otherwise noted. Factual information believed to reliable, was used to formulate these statements of opinion; but we cannot guarantee the accuracy and completeness of the information being relied upon. Accordingly, these statements do not necessarily reflect the viewpoints employed by the FCM Division of StoneX Financial Inc. or SXM. All forecasts of market conditions are inherently subjective and speculative, and actual results and subsequent forecasts may vary significantly from these forecasts. No assurance or guarantee is made that these forecasts will be achieved. Any examples given are provided for illustrative purposes only, and no representation is being made that any person will or is likely to achieve profits or losses similar to those examples.
Reproduction or use in any format without authorization is forbidden. © 2022 StoneX Group Inc. All rights reserved.

