Five Items to Watch Across Global Markets for Next Week
Macro Strategy – Talking Points
- Nasdaq and S&P 500 Futures finally find some resistance – but can it turn into anything more than a short-term pullback?
- European political risk has pushed an aggressive pullback in French stocks, and the Euro is working on its third consecutive weekly loss. Can politics elicit a breach of the 17-month-range in both the Euro and the US Dollar?
- I look into this and three more pertinent macro items below
Sign Up for a Free Market Outlook Webinar Covering Global Markets
Nasdaq, S&P 500 Pull Back – Can it Turn into Anything More Than That?
Stocks have been in a scorching rally since the May open, and that statement can pretty much be extended all the way back to last November. In both instances, there was a FOMC rate decision concluding on the first day of both months and bulls made a noticeable impact to stocks after. The Fed has retained a fairly-dovish outlook, all factors considered, and US data has remained rather strong. That sets up a potentially goldilocks-like backdrop where markets can look to the horizon and dream on rate cuts, which could make for an even more bullish case in equities, while also operating with a relatively strong economic backdrop that’s kept consumer spending and revenues for corporates rising.
Of late, however, there’s been a bit of bifurcation which has highlighted one of the major bullish factors that’s had such importance sway over the past couple years: the AI-craze that’s swept US equity markets. This has led to a much stronger recent backdrop in the S&P 500 and Nasdaq relative to the Dow and Russell 2000.
NVDA has been the leader of the pack and last week finally showed some pullback in the trend after a roaring rally that’s largely held since the company’s last earnings report. I have that gap from their prior earnings announcement marked in yellow on the below chart; but as of this writing, bears haven’t even let prices re-test that level, and bulls have jumped in to defend a gap from the prior week.
NVDA Four-Hour Price Chart
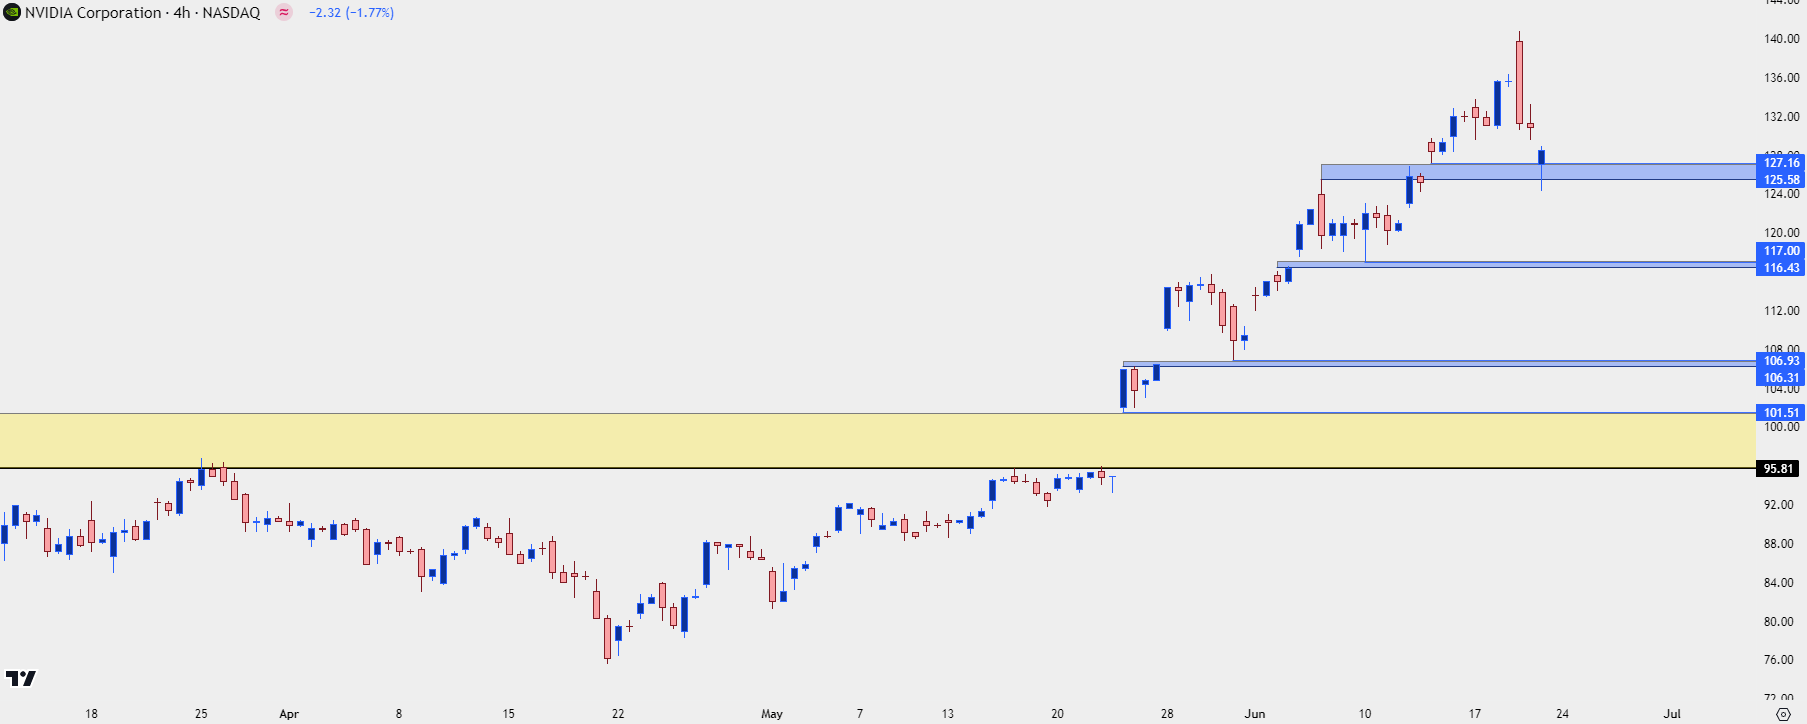
Chart prepared by James Stanley; Source Tradingview
Nasdaq 20,000
As that pullback in NVDA showed up with a bearish engulf on Thursday, the Nasdaq finally showed some pullback, as well, testing back-below the psychological 20,000 level on Nasdaq futures. That test continues to take place as of this writing; but there remains considerable support structure below current price, with swings at 19,900, 19,760 and 19,688 before the 19,500 level comes back into play.
Nasdaq 100 Futures (NQ) Four-Hour Price Chart
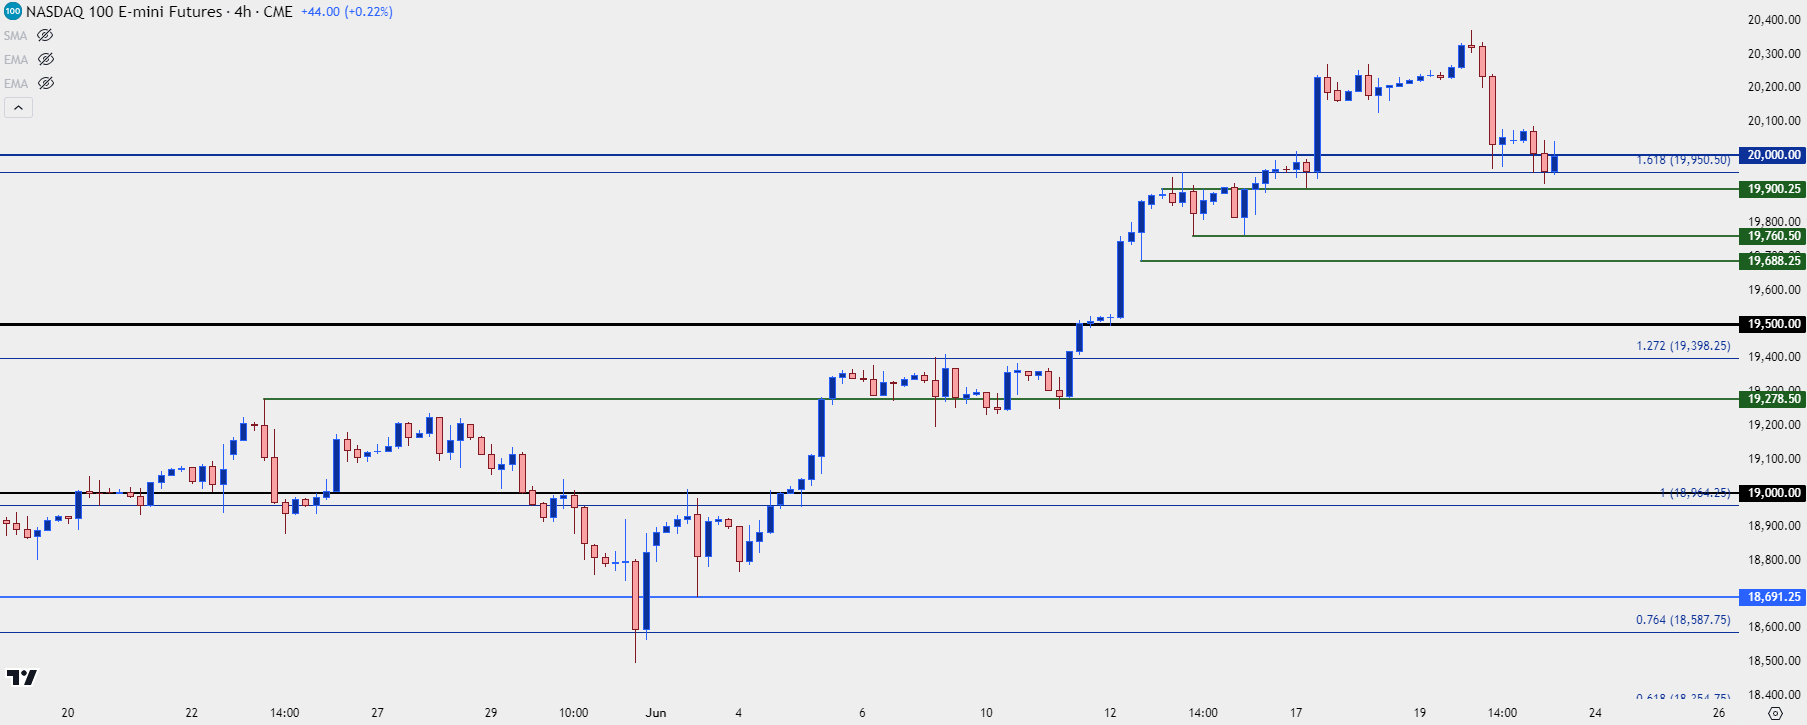
Chart prepared by James Stanley; Source Tradingview
S&P 500
The S&P hasn’t quite been able to keep pace with the Nasdaq; and given the heavier allocation of tech, AI-driven names in the latter index, that makes sense. The S&P 500 has been strong nonetheless, setting another fresh all-time-high on Thursday before staging a pullback.
Resistance has held at the 161.8% Fibonacci projection from the Q2 pullback move and that price was in-play as the high on Monday, holding through the rest of the week.
For support, as of this writing, we haven’t yet seen a re-test of the 5,500 level; and that remains of interest. That price held the highs for two days while building near perfect dojis candlesticks; and as of yet, it hasn’t been re-tested for support. If that can’t hold, 5,434 remains of interest followed by the 5,400 psychological level, noted with a black horizontal line on the below chart.
S&P 500 Futures (ES) Daily Price Chart
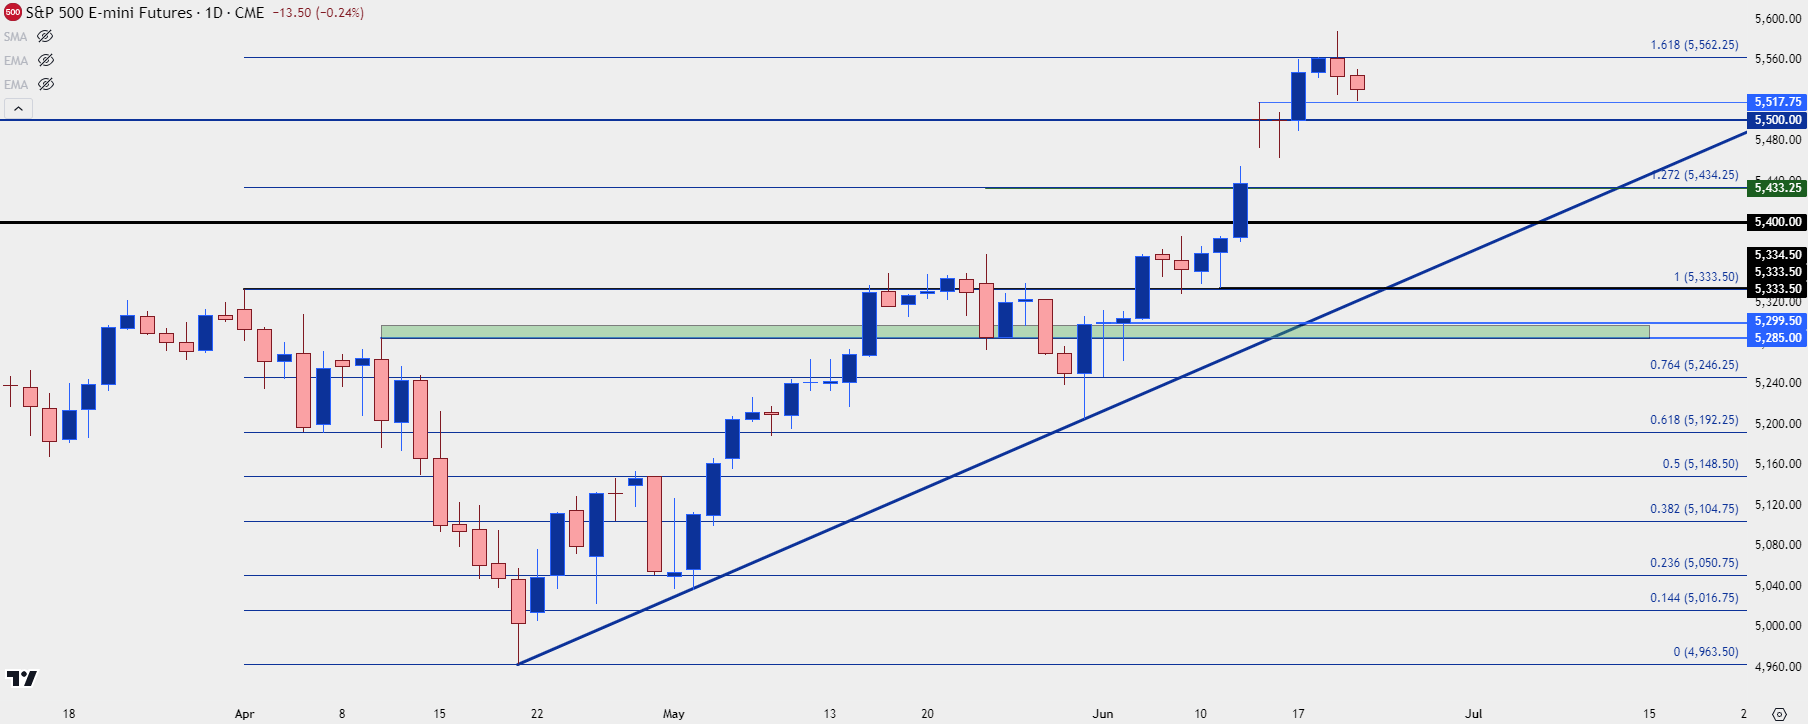
Chart prepared by James Stanley; data derived from Tradingview
Russell 2000
While the Nasdaq and S&P 500 show strong bullish markets driven by aggressive breakouts, the same can’t be said across the broader market. And, the Russell 2000 illustrates this well.
The small cap index has continued to lag the large cap indices and last week opened in a bearish manner – with a test below its own 2,000 psychological level on Monday. That slip wouldn’t gain acceptance from bears, however, and buyers piled in to push a pullback. But that has so far failed to breach Fibonacci resistance at 2,050 which held on both Tuesday and Thursday.
The divergence amongst these indices highlights the fact that this is a thin rally, driven by AI-hope and backed by the premise of cheap rates coming back into the equation at some point. But, after blistering rallies that started last October with a major boost at the November 1st FOMC meeting, the question has started to populate: Are buyers getting beleaguered?
That shows a bit more clearly in the Russell 2000, where the index remains well-below the April 1st high that printed on the first day of Q2 trade.
Russell 2000 Futures (RTY) Daily Price Chart
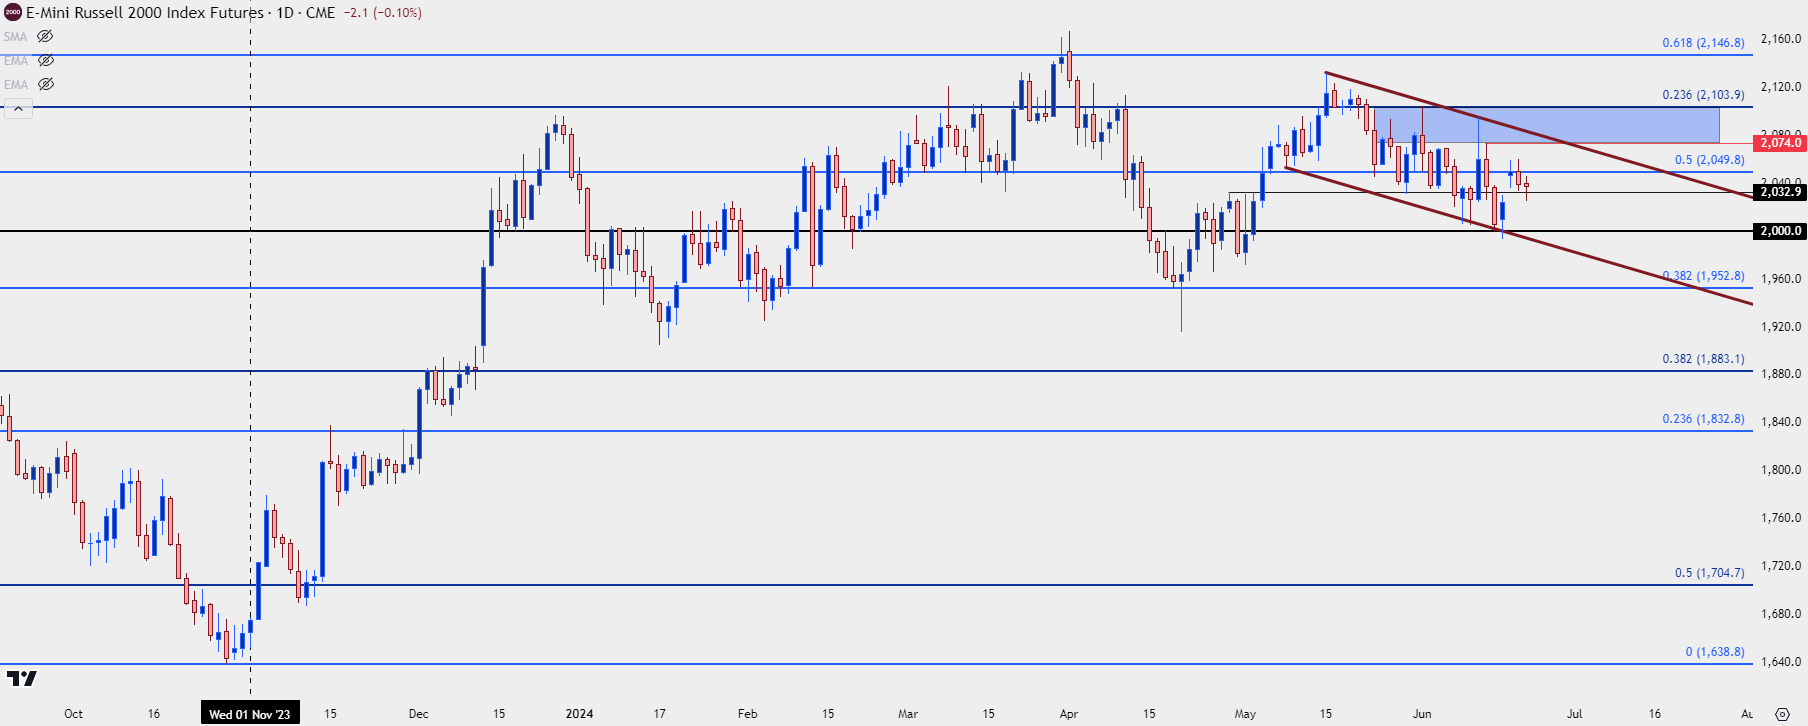
Chart prepared by James Stanley; Source Tradingview
European Political Risk
Outside of the U.S., there’s been a rise in political risk in Europe and we’re nearing the first round of the National Assembly election on June 30th. At this point, Marine Le Pen’s National Rally party is polling very well, and this presents the possibility of her party gaining an absolute majority in the second round of elections set for July 7th.
French stocks have already taken a hit over the past month, at one point erasing more than 50% of the rally that began last October. Last week was largely one of recovery; but that bounce hit from oversold conditions, so the question remains as to whether there’s any continuation potential for bulls, or whether bears will use that bounce to sell at a higher price. There remain a few spots of possible resistance sitting overhead.
CAC 40 Daily Chart
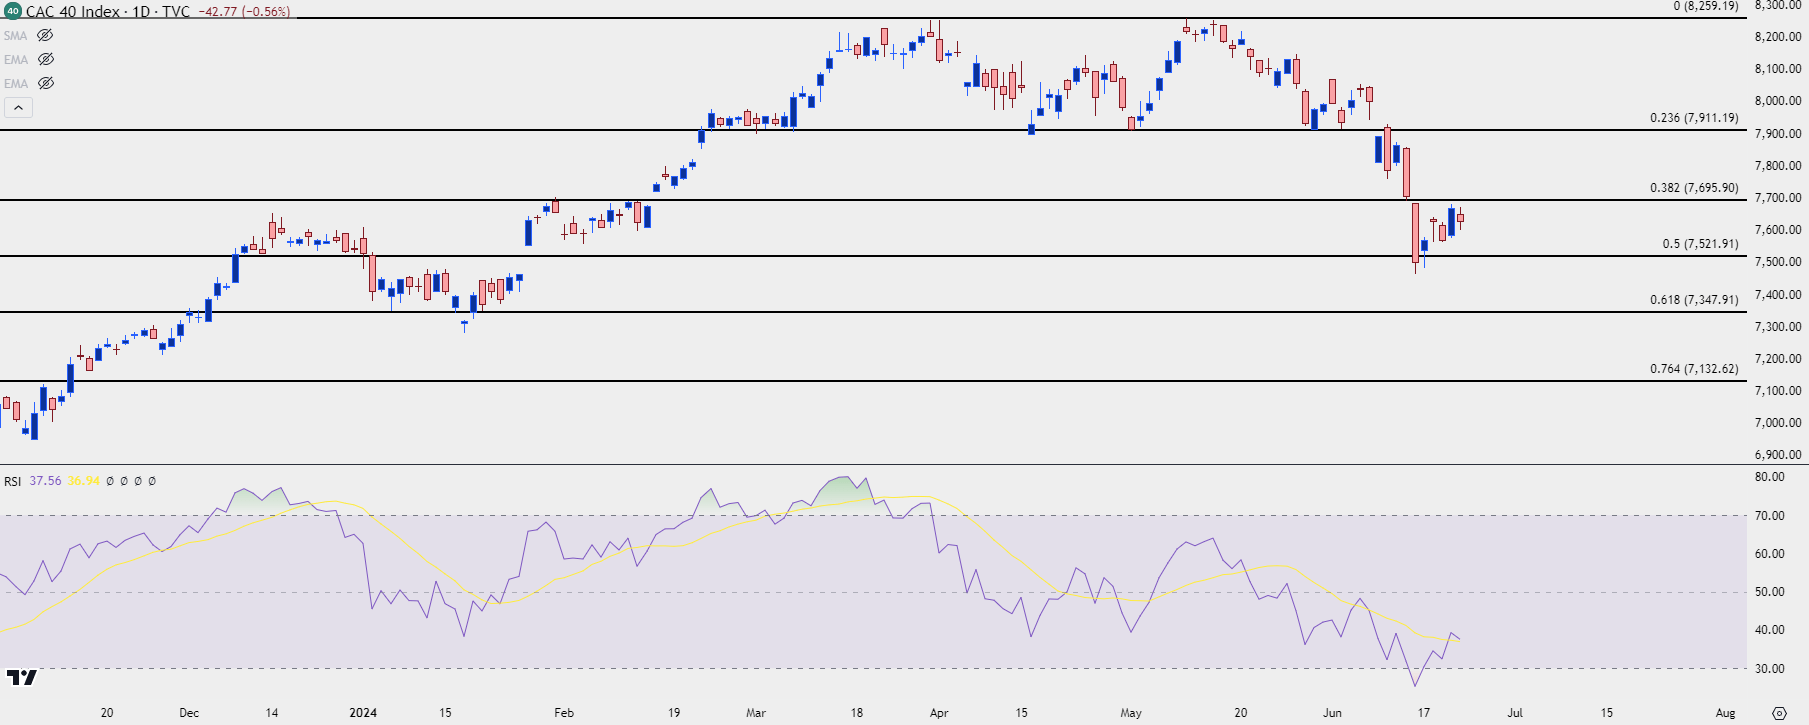
Chart prepared by James Stanley; data derived from Tradingview
EUR/USD
In the currency market, the Euro has been relatively stable given the turmoil in the headlines and the retreat in stocks as highlighted at above. But that’s largely a case of continuation as EUR/USD has been range-bound now for more than almost 18 months. The big question at this point is whether political tension weighs on the single currency, allowing for another test of range support, which I’ve aligned on the below chart from around the 1.0500 spot up to the Fibonacci level at 1.0611.
I’ll have more to say on the matter for our third item to watch for next week: the US Dollar.
EUR/USD Weekly Price Chart
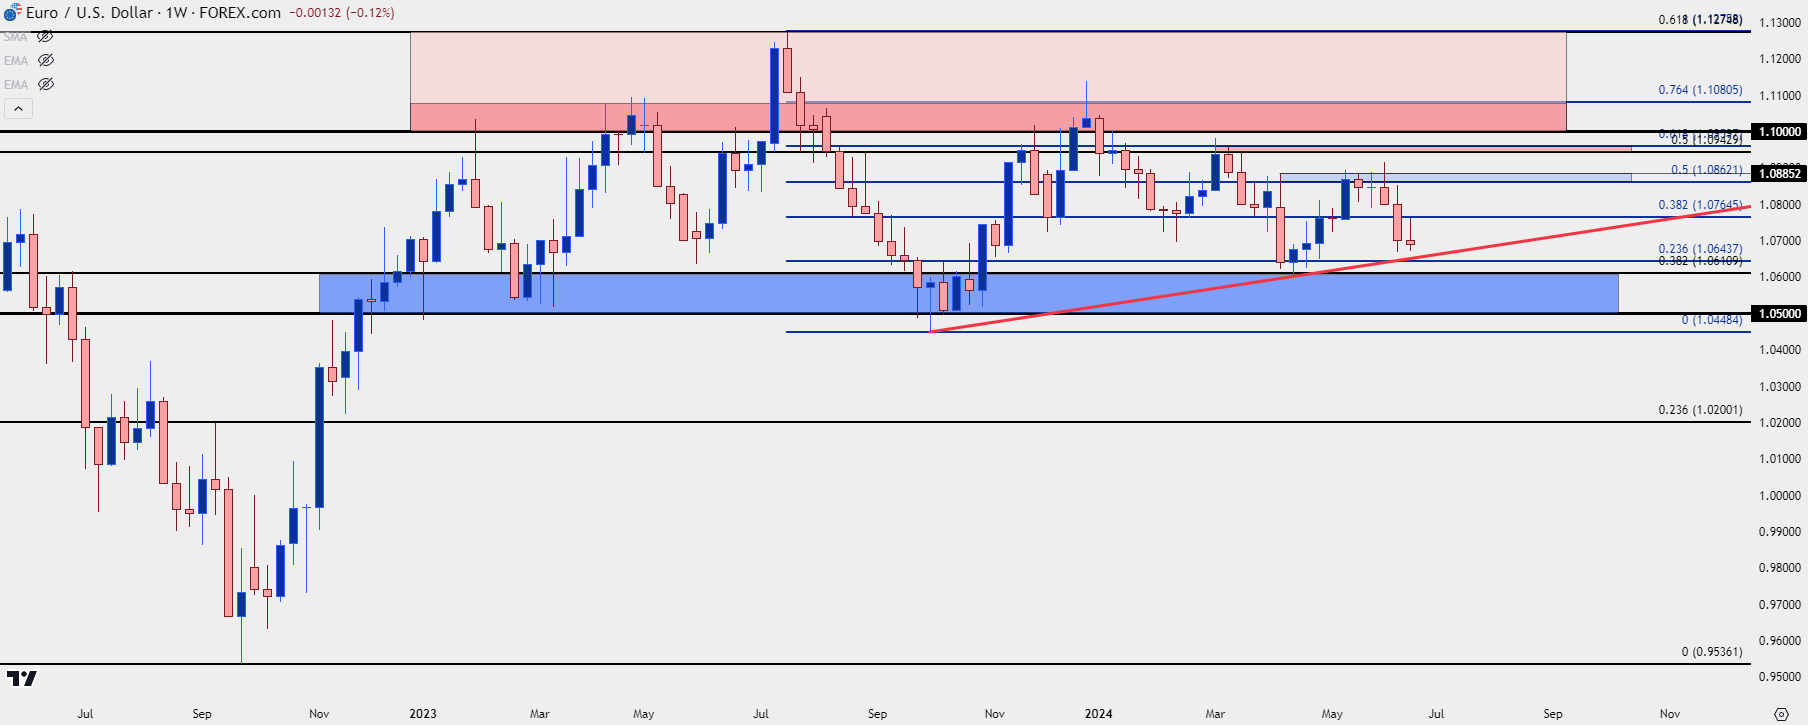
Chart prepared by James Stanley, EUR/USD on Tradingview
US Dollar Strength Holds – Is DXY About to Create Damage?
The US Dollar is working on its third consecutive weekly gain; and given the fact that the DXY basket is comprised of a 57.6% allocation of Euro, it makes sense when meshed with the above chart of EUR/USD. But, like EUR/USD, the US Dollar has been range-bound for almost a full year-and-a-half now, which shows well on the weekly chart below.
Also notable is the fact that there were six consecutive weeks of support tests at the 200-day moving average, all of which held on a weekly-close basis. The past week was the first that the 200-dma did not trade in the USD since early-May, and this shows bulls taking a bit more control of near-term price action.
US Dollar Weekly Price Chart
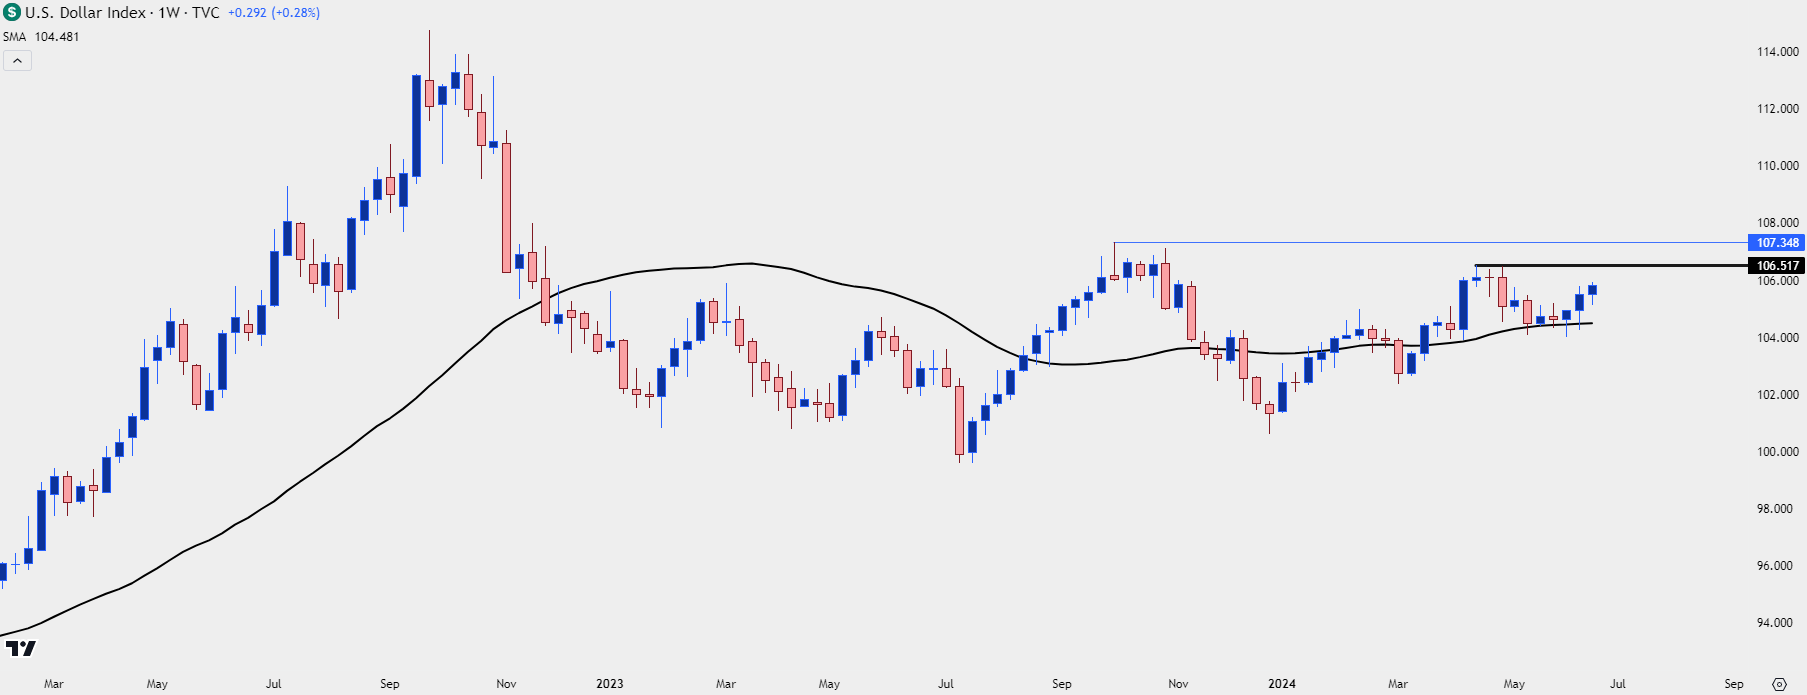
Chart prepared by James Stanley; Source Tradingview
USD: A Date with the Gap?
As noted above regarding stocks, the November 1st rate decision last year was a key pivot point for several markets. That’s when the equities really began to rally with aggression into the end of the year; and that strength has largely remained, especially in NVDA, NQ and ES. But it was also a meeting that aligned to the turn lower in the US Dollar.
The Fed sounded very dovish at that meeting even with US data having remained relatively strong. The NFP report a couple days after the rate decision in November printed poorly, giving bears ammunition to drive a deeper sell-off in the USD which largely lasted into the last couple days of the year.
The gap produced by that meeting on November 1st remains in-play, and the bottom portion of that gap came back into the equation in mid-April. It was in-play again a couple weeks later in the lead up to the May rate decision from the Fed; and, once again, the Fed sounded more dovish than what the data had seemed to warrant. But, that dovishness helped to hold resistance at the bottom of the gap at 106.50, after which bears took control for the next couple of weeks. That’s when price began to re-test the 200-day moving average, and this is when the grind at the indicator had started again.
The Fed didn’t sound as dovish a couple weeks ago, and that’s helped bulls to get back in the driver’s seat of the US Dollar. This has played a role in the above matter on EUR/USD as the currency pair is working on its third consecutive weekly loss. But, if EUR/USD is going to push down into that longer-term range support - or perhaps break even lower as it is driven by political risk - then it’ll likely need some help from the US Dollar making a move on resistance. And, the gap produced by the November FOMC rate decision could soon become vulnerable after two holds in early-Q2 trade. This plots from the 2024 high of 106.50 up to the 106.88 level on DXY.
US Dollar (DXY) Daily Price Chart
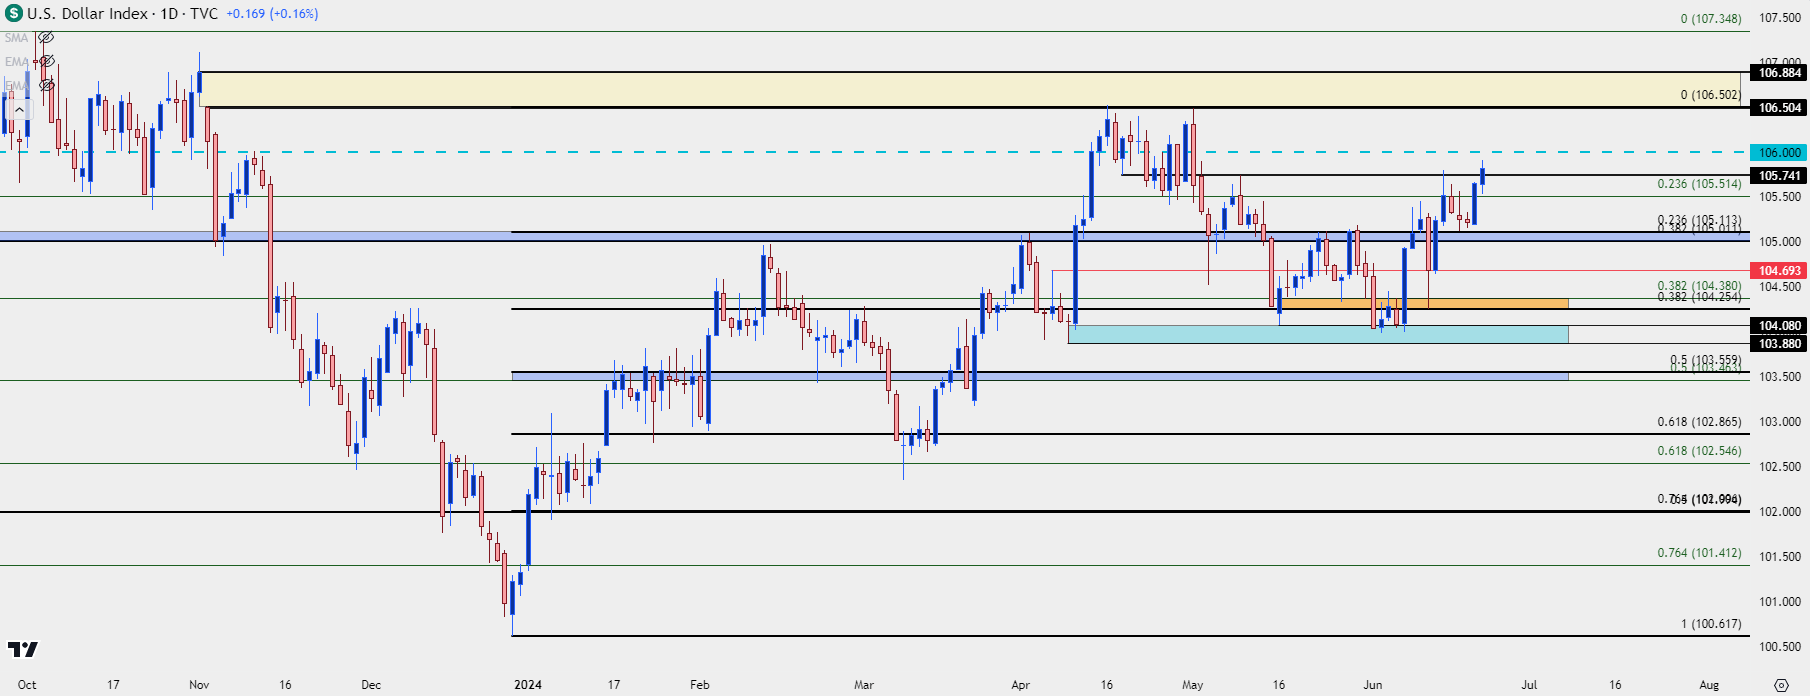
Chart prepared by James Stanley; Source Tradingview
USD/MXN
USD/MXN isn’t as popular of a market, but it does intertwine a few of the themes investigated above.
USD/MXN has been in a down-trend for four years now after topping just after the Covid pandemic came into play. While the US has seen numerous rate hikes since the Fed began to adjust rates in 2022, interest rates have remained higher in Mexico; and that’s led to a positive carry scenario for shorts and a negative carry scenario for longs.
In the FX market, this can make a mark as traders can earn daily rollover simply for being short USD/MXN, based on that rate divergence between the underlying economies. If more traders line up to voice a similar view, well, as you can see below, that can feed into a trend that can last for a long time, possibly even years. And at that point, market participants can pursue both principal gains and daily rollover payments based on the rate divergence of the underlying economies. In USD/MXN, that’s one of the few pairs where traders can earn rollover for being short the US Dollar.
But – those situations can soon lead into crowded trades, and crowded trades can snap back with aggression when some element of change presents the possibility of turmoil.
Mexican elections in early-June unsettled the matter, and this created a carry unwind scenario in which USD/MXN retraced more than 23.6% of the four-year trend. That resistance around the 23.6% Fibonacci retracement held around 18.050 and last week presented a lower-high, giving the idea that this resistance could potentially hold.
I wanted to note the matter in this article as traders looking to fade the recent rally in the US Dollar might find some compelling elements in USD/MXN. And while USD was strong last week, the Mexican Peso has been stronger as indicated by the red candle for last week’s outing.
At this point, there’s negative carry for longs and positive carry for shorts, and unless the US Dollar puts in a strong bullish move to and perhaps even through the gap noted above on DXY, USD/MXN could be an attractive candidate for bearish USD exposure.
USD/MXN Weekly Price Chart
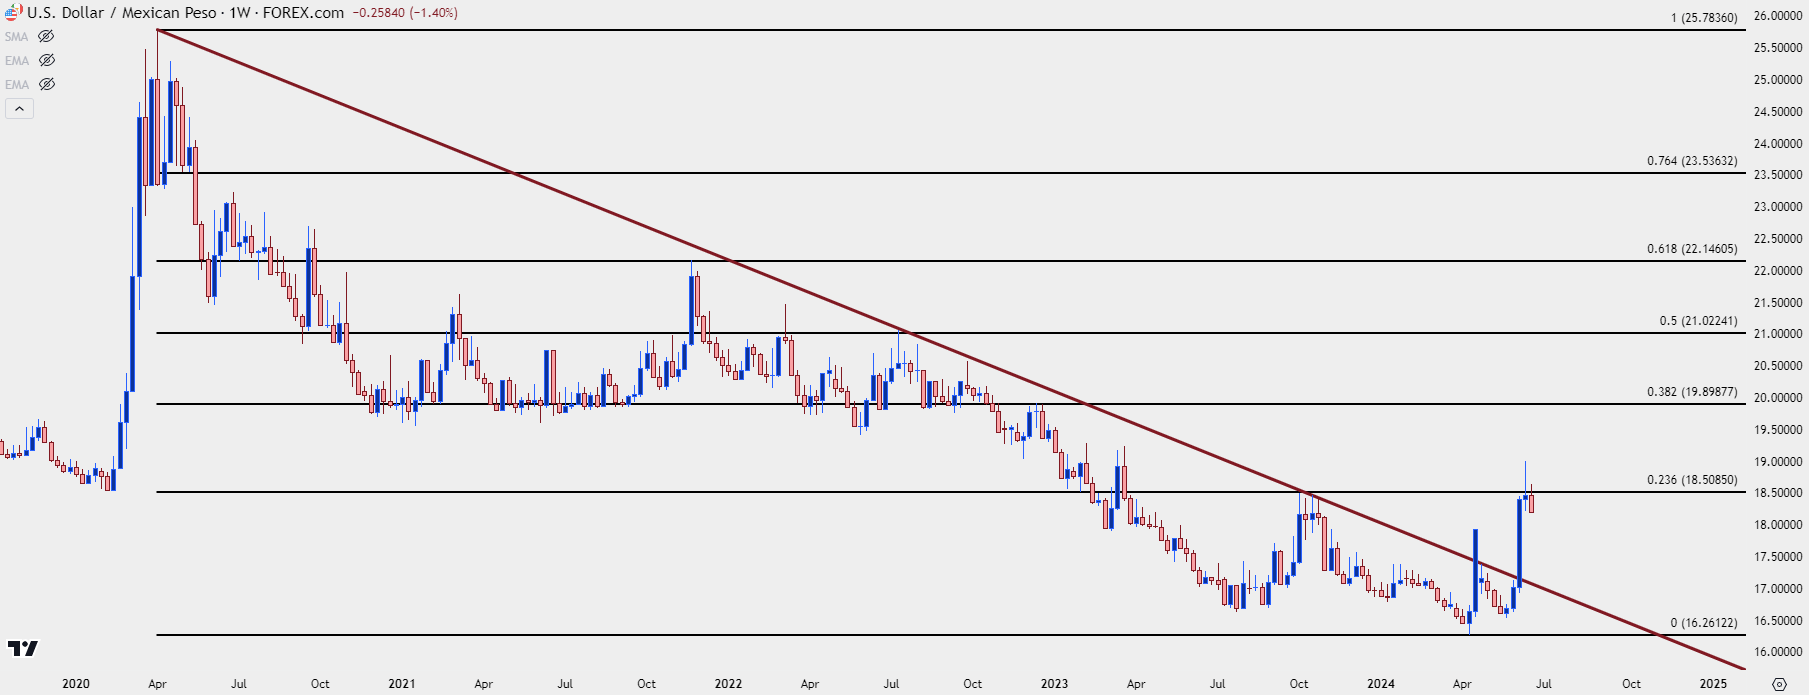
Chart prepared by James Stanley, Source Tradingview
Crude Conundrum
It was a painful first two months of Q2 for crude oil prices. After topping the 85-handle, crude prices fell all the way down to a low of $72.08 in early-June. But bulls started to come back on June 5th,, and they’ve largely remained aggressive ever since.
Initially, price pushed back to the 200-day moving average, which held resistance for a week, after which bulls pressed again on Monday after the open to re-test the 80-handle. Last week showed only minimal resistance there, with buyers again driving to a fresh two-month-high.
The big question now is whether they can retain control of the trend after a near 12% gain developed in a few short weeks; and for that, the big question is support defense. There’s support potential at the 80-handle, along with the Fibonacci level plotted at 79.15 and then the 200-day moving average which is confluent with the 38.2% retracement from that same study, plotted in a zone between $77.47 and $77.67.
WTI Crude Oil Futures (CL) Daily Price Chart
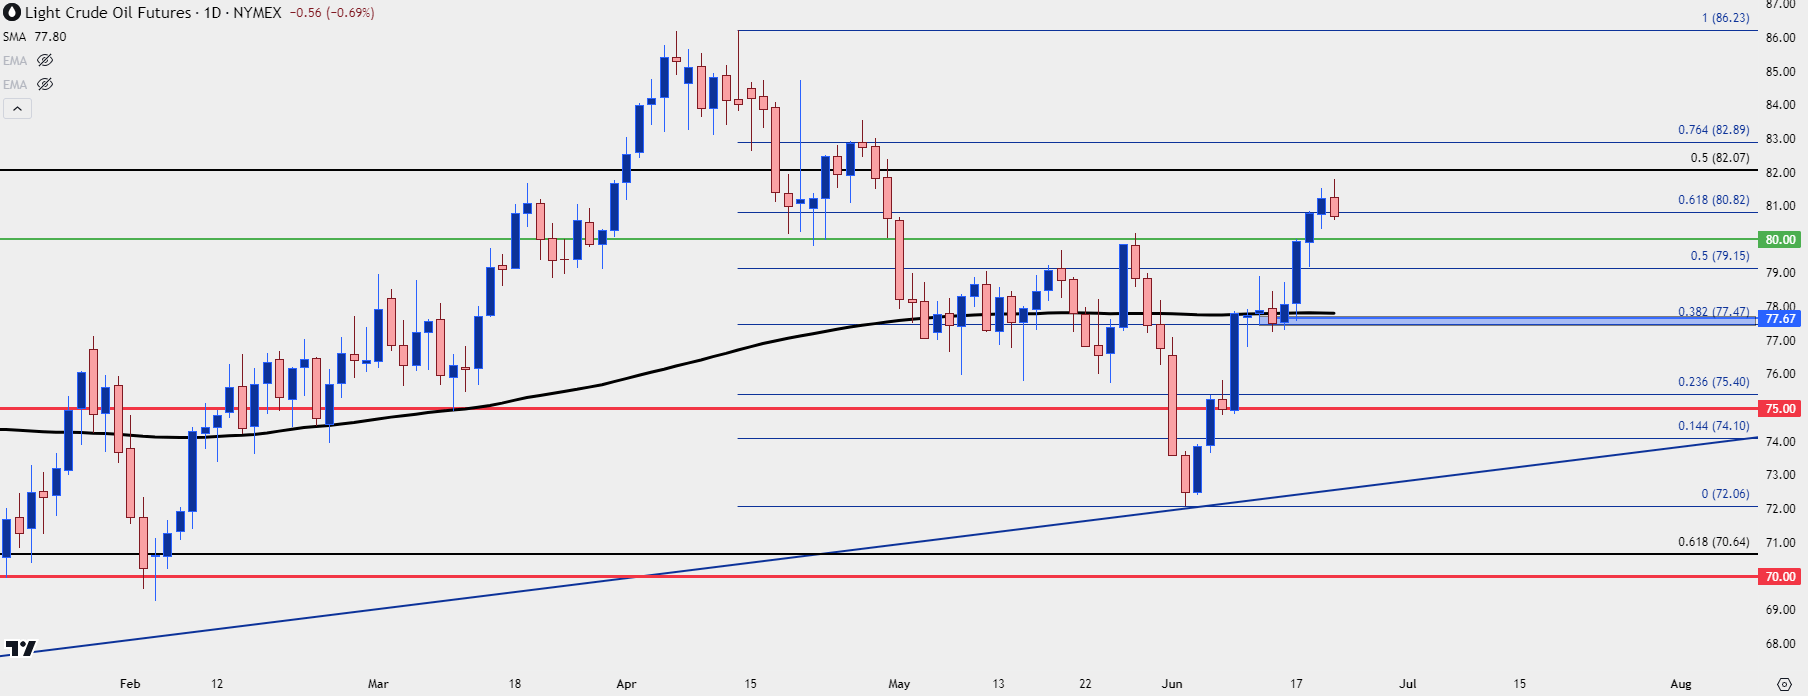
Chart prepared by James Stanley; Source Tradingview
Sign Up for a Free Market Outlook Webinar Covering Global Markets
Written by James Stanley, Senior Strategist for Forex.com
The information on this web site is not targeted at the general public of any particular country. It is not intended for distribution to residents in any country where such distribution or use would contravene any local law or regulatory requirement. The information and opinions in this report are for general information use only and are not intended as an offer or solicitation with respect to the purchase or sale of any currency or CFD contract. All opinions and information contained in this report are subject to change without notice. This report has been prepared without regard to the specific investment objectives, financial situation and needs of any particular recipient. Any references to historical price movements or levels is informational based on our analysis and we do not represent or warranty that any such movements or levels are likely to reoccur in the future. While the information contained herein was obtained from sources believed to be reliable, author does not guarantee its accuracy or completeness, nor does author assume any liability for any direct, indirect or consequential loss that may result from the reliance by any person upon any such information or opinions.
Futures, Options on Futures, Foreign Exchange and other leveraged products involves significant risk of loss and is not suitable for all investors. Losses can exceed your deposits. Increasing leverage increases risk. Spot Gold and Silver contracts are not subject to regulation under the U.S. Commodity Exchange Act. Contracts for Difference (CFDs) are not available for US residents. Before deciding to trade forex, commodity futures, or digital assets, you should carefully consider your financial objectives, level of experience and risk appetite. Any opinions, news, research, analyses, prices or other information contained herein is intended as general information about the subject matter covered and is provided with the understanding that we do not provide any investment, legal, or tax advice. You should consult with appropriate counsel or other advisors on all investment, legal, or tax matters. References to FOREX.com or GAIN Capital refer to StoneX Group Inc. and its subsidiaries. Please read Characteristics and Risks of Standardized Options.

