

Tactical Strategies - Macro Pitchbook July 2024
Desk Description
The Tactical Strategies desk has been providing our unique and award-winning analytics to a sophisticated trading community for 15 years. Having access to our trend following model can really enhance your trading efforts while gaining an understanding of order flow. Analytics will examine not only flat price, but also numerous relative value structures. Most of our quantitative lens focuses on daily data, but there will be times where both longer or shorter term inputs are implemented.
A large component of our offering includes insight into our trend following model, with the first 2 pages of this presentation focusing on that feature. Our trend model uses medium to longer term exponential moving averages to generate signals. Since the utilized moving averages are not short term, signals can have a lengthy duration. All new signals or technical conditions are entered basis the close on the new signal date. New entry is executed basis TAS, providing very little slippage.
The methodology engrained into this system is a bit different than most trend followers. Profitable trades are reduced (grid of current signals at bottom of page will show different percentages on remaining positions) at optimized predetermined data points. Thus, lowering risk and margin, which enables this model to outperform many peers in sideways trading environments. Stops are based off of volatility metrics which reflect recent trading ranges.
The remainder of this pitchbook will examine other quantitative techniques and technical indicators that we apply in various studies. This may include metrics such as mean reversion, momentum based, identifying overextended or distressed conditions, as well as defining severe market compression which may offer options related opportunities appealing to volatility traders.
Click here to subscribe to free 6 week trial
Current Trend Model Positions
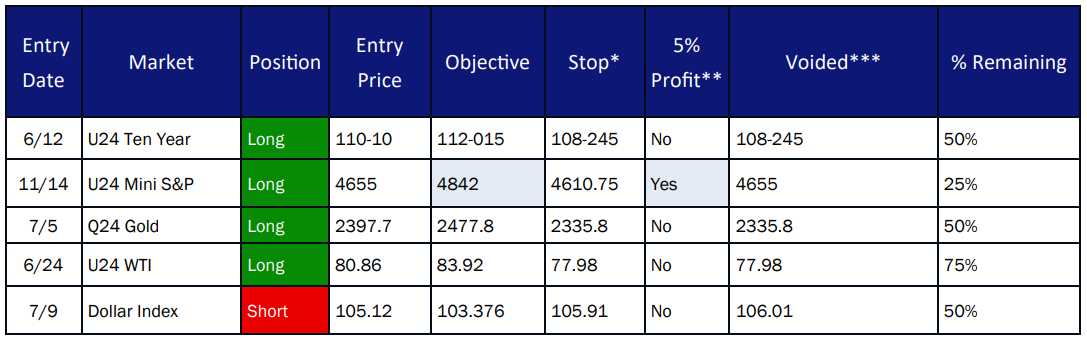
Source: CQG
Model Driven Snapshot
Source: CQG
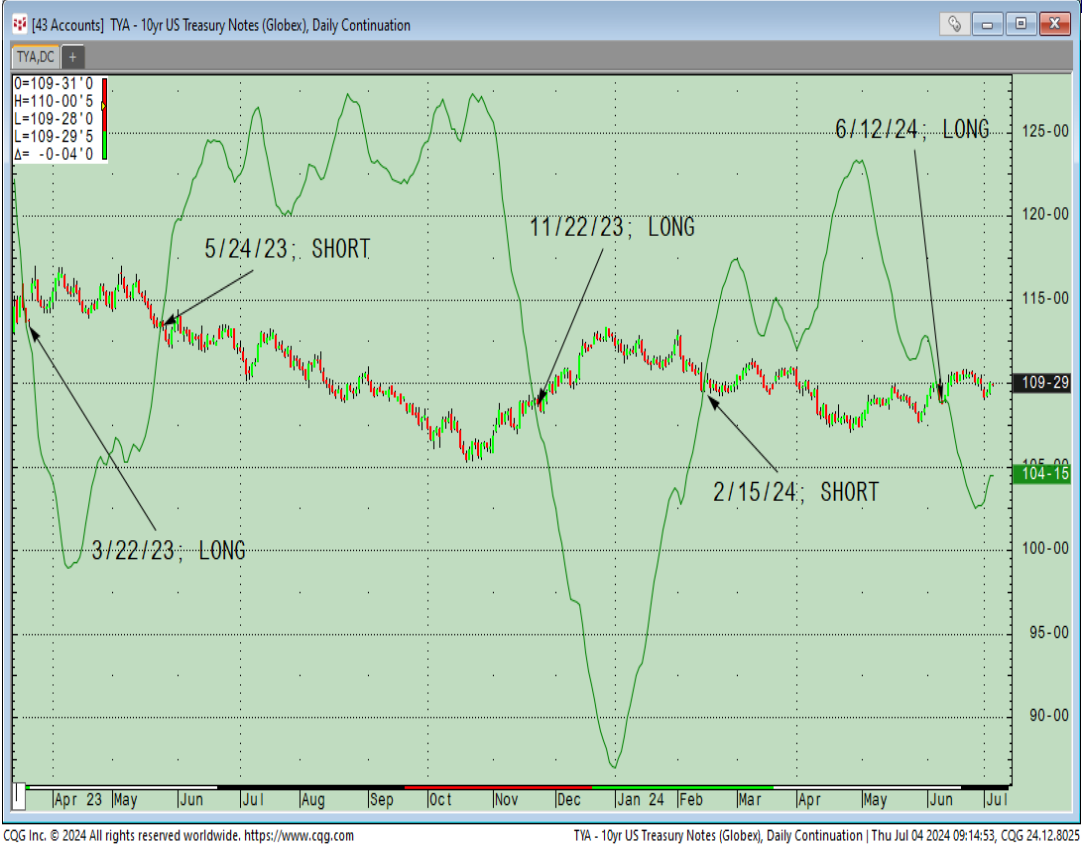
Ten Year Futures
Above is a chart of Ten Year Futures with our trend model overlayed. A new close above the green trigger line (group of optimized exponential moving averages) produces a long signal. Conversely, a new settlement below the green line generates a sell signal. In the past 15 months there have been 5 signals. The first 4 signals were all profitable, with current long achieving 1 profit target thus far.
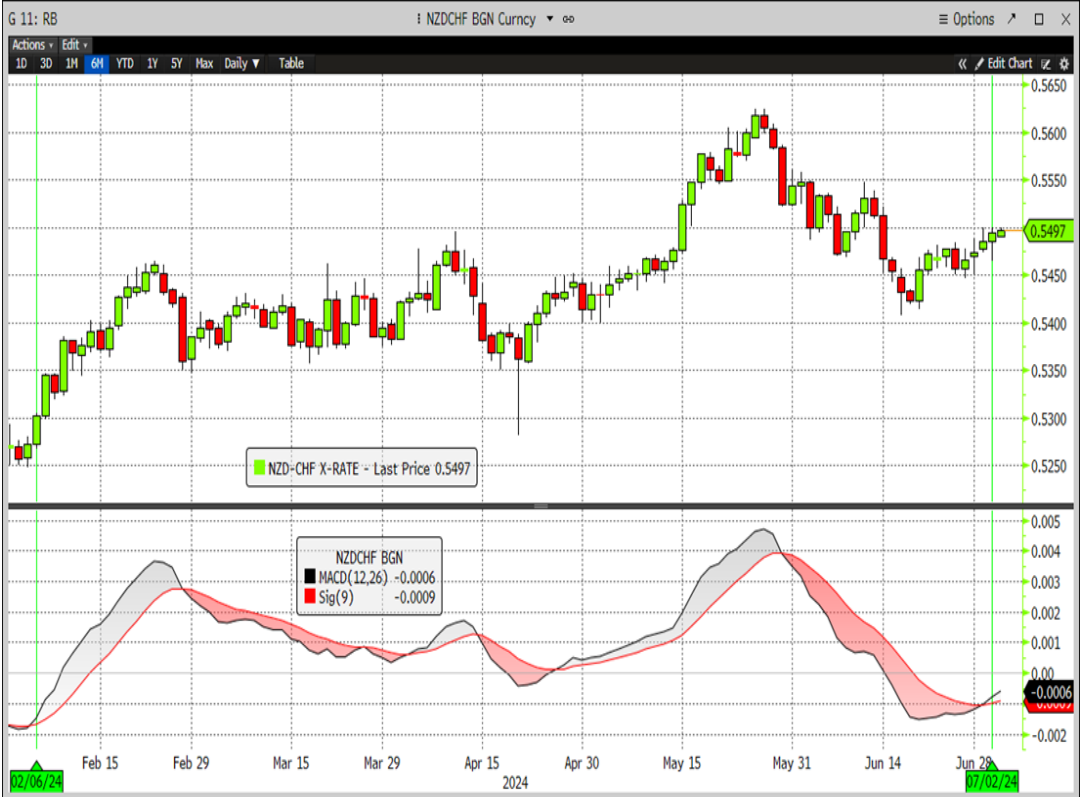
Use of Shorter Term Momentum Indicator
Source: CQG
New Zealand Dollar vs. Swiss Franc
The above examines a form of a momentum indicator much shorter in duration than our trend following model.
Sent: Wednesday, July 3, 2024 6:34 AM
Subject: New Zealand Dollar vs. Swiss Franc cross: positive momentum confirmed
New Zealand Dollar vs. Swiss Franc cross: a positive MACD crossover from below the Zero Line occurred on 7/2 (lower pane; bullish New Zealand ). Prior similar setup denoted in green vertical line.
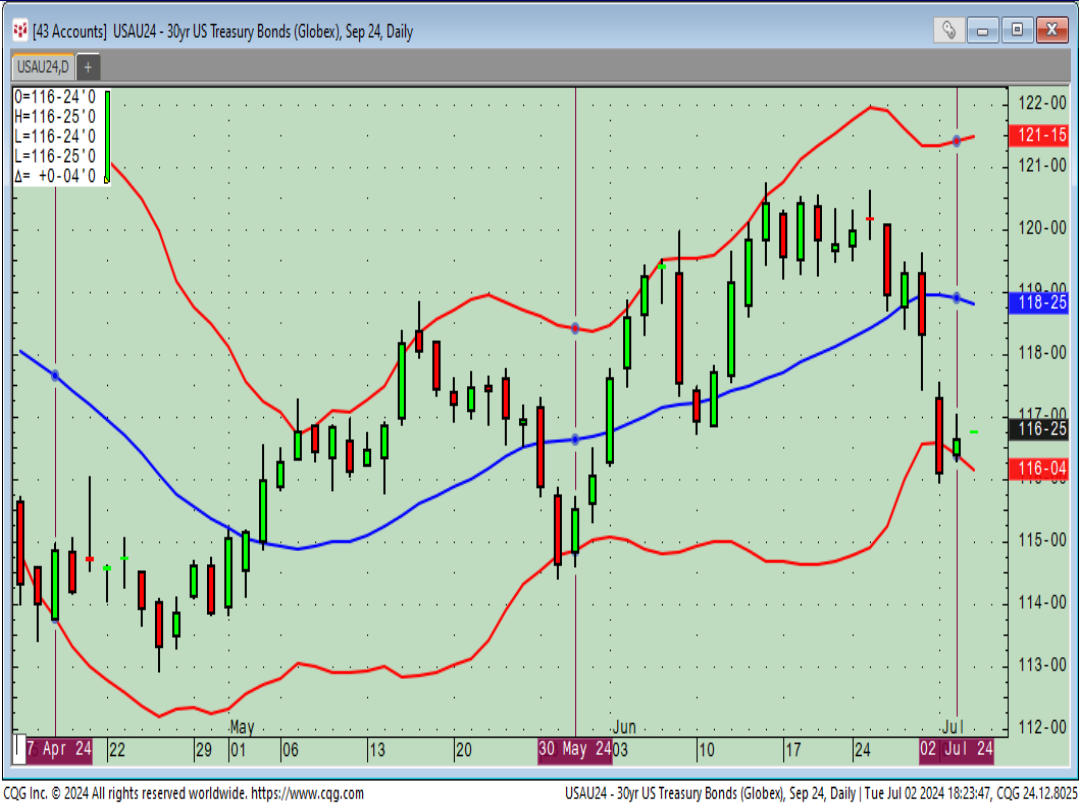
Use of Mean Reverting Indicator
Source: CQG
U 2024 Thirty Year
While momentum based indicators still dominate the technical trading landscape, reversal patterns and conditions have increased in usage over the past several years.
Sent: Tuesday, July 2, 2024 6:27 PM
Subject: U24 Thirty Year: positive reversal
U24 Thirty Year Futures: on 7/2, a positive mean reverting close above the lower Bollinger Band was confirmed. Prior similar setups via purple vertical lines.
Compression Analysis
Source: CQG
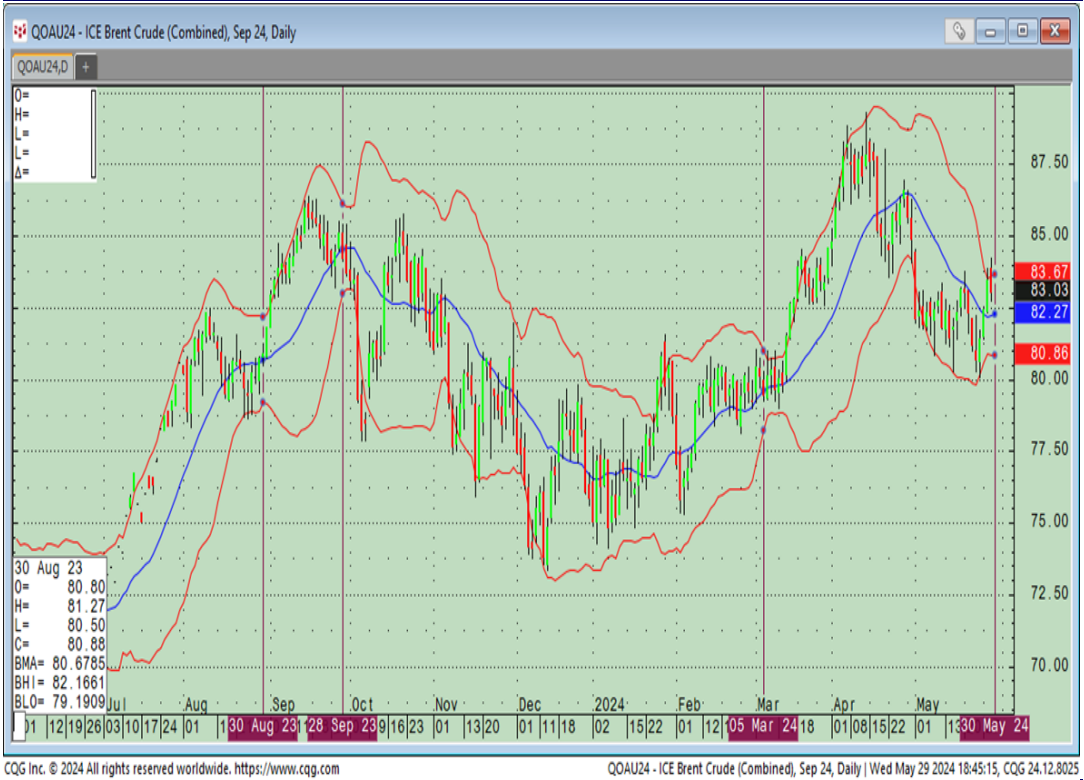
U 2024 WTI
One of our more esoteric studies is compression analysis which often speaks to the sensibilities of options traders. This algorithm finds defined areas of a sideways trading environment. Once a signal is generated, this model purchase the at the money straddle in the underlying instrument.
Sent: Friday, May 31, 2024 8:42 AM
Subject: WTI on the move....straddle signal
U 2024 WTI: the Bollinger Bands (red lines) are into an historically narrow width. When this occurs, it typically signifies that a market is about to break from its current trading range. One way to express this condition, as a trade, is to buy the at the money straddle with 4 to 6 weeks of time. This study does not predict direction, but can also be used as a pressing point if directionally passionate. Essentially, it is a delta predictor. Prior signals highlighted via purple vertical lines.
This material should be construed as the solicitation of an account, order, and/or services provided by the FCM Division of StoneX Financial Inc. (“SFI”) (NFA ID: 0476094) or StoneX Markets LLC (“SXM”) (NFA ID: 0449652) and represents the opinions and viewpoints of the author. It does not constitute an individualized recommendation or take into account the particular trading objectives, financial situations, or needs of individual customers. Additionally, this material should not be construed as research material. The trading of derivatives such as futures, options, and over-the-counter (OTC) products or “swaps” may not be suitable for all investors. Derivatives trading involves substantial risk of loss, and you should fully understand the risks prior to trading. Past results are not necessarily indicative of future results.
All references to and discussion of OTC products or swaps are made solely on behalf of SXM. All references to futures and options on futures trading are made solely on behalf of SFI. SXM products are intended to be traded only by individuals or firms who qualify under CFTC rules as an ‘Eligible Contract Participant’ (“ECP”) and who have been accepted as customers of SXM.
SFI and SXM are not responsible for any redistribution of this material by third parties, or any trading decisions taken by persons not intended to view this material. Information contained herein was obtained from sources believed to be reliable, but is not guaranteed as to its accuracy. Contact designated personnel from SFI or SXM for specific trading advice to meet your trading preferences.
Reproduction or use in any format without authorization is forbidden.
© Copyright 2024. All rights reserved.
Discover more insights