
LBMA Precious Metals daily turnover patterns January 2024 and comparison with previous; influences and inferences
Rhona O'Connell, Head of Market Analysis, EMEA & Asia
Tel: +44 203 580 6115 / mobile +44 7384 833897
LBMA Precious Metals market volumes, January 2025, and their significance
Rhona O’Connell, StoneX Financial Ltd; 10 February 2025
Any views expressed here are of the writer and do not reflect a house view from NASDAQ.
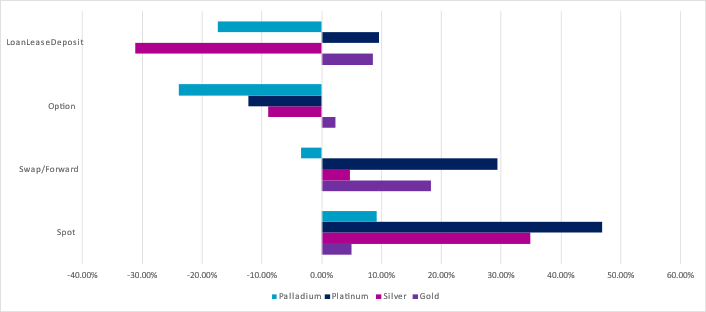
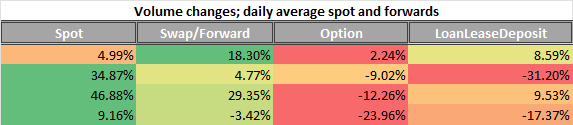
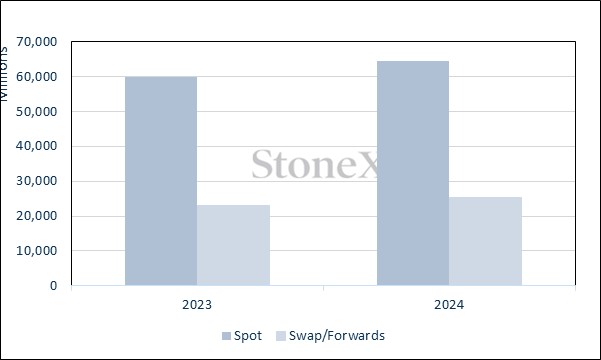
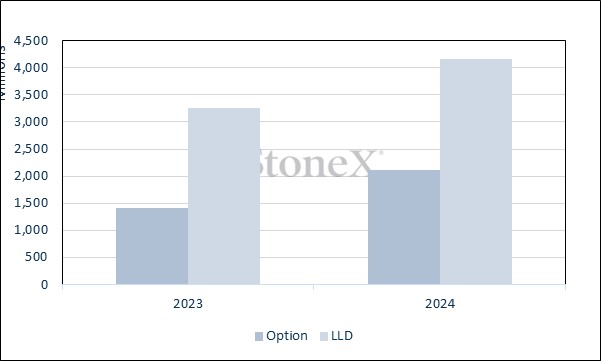
Daily January average compared with daily average for 2024
Source: LBMA
Source: LBMA
Welcome to our monthly round-up of the LBMA OTC trading volumes in gold, silver, platinum and palladium, as recorded on a daily basis by the Association. These are split into spot, swap/forward, options and LoanLeaseDeposit (LLD) and give a flavour of the markets’ activity and how they were influenced by external forces and news items.
All references to COMEX or NYMEX positioning refer to Managed Money, not commercial positions.
General introduction: -
January was all about risk and political uncertainty, and especially the dislocation of precious metals between London and New York. As we write in early February it is worth looking at the current situation as well as just looking back at January, as the situation has not yet resolved itself.
The London / New York dislocations
The movements of precious metals into CME warehouses reflects risk managers in financial houses not taking any chances with respect to tariffs, even though gold as a reserve asset would be most unlikely to have tariffs levied. A lot of banks / finance houses hedge their London physical metal long positions by taking an offsetting futures position on COMEX - and capturing the contango accordingly. So they are now getting gold into the country (not only into COMEX) as rapidly as possible, just in case. Platinum has been the most dramatic with a 204% gain in inventory since early December. Palladium has just started to move with a 29% increase this week (early February), while silver has been more pragmatic, only up by 17%. There have been unhelpful noises in the press and elsewhere, talking about the possibility of a silver squeeze. Silver is notoriously vulnerable to this kind of talk but there is a lot of metal theoretically available in the States, but which has not been released into the market -- again, risk managers staying their hands.
This switching the long loco London / short loco COMEX is done via the EFP (Exchange Futures for Physical); these trades are bilateral OTC and so we won't have seen a concomitant increase in COMEX volumes. It does, however, show up in the spot volumes as recorded by the LBMA, so that will feature in the individual sections of this piece.
At the start of 2020 there were 271t of gold in COMEX warehouses. Material started arriving late in March (which makes sense) and peaked around 1,161t in mid-August then started coming off gradually before picking up again in 2021. Gentle falls over 2023 and 2024 but the recent moves, with 480t going in since early December, have taken inventories to 1,034t, the highest since 27th June 2022.
With lease rates still high, I am put in mind of the panic in the market in September 1999 when the small print of the Central Bank Gold Agreement stated that, as well as restoring central bank sales to a maximum quota, the signatories to the Agreement (15 central banks including the ECB) said that the hedge book would not be expanded from prevailing levels. This caused a stampede to cover shorts, with gold-for-a-day shooting out to 40%. I am pretty sure that it was on this occasion that a senior central banker said that central banks would stand ready to provide liquidity if necessary. There was some lending into the December EFP blow-out and it may also have happened again in early February.
Loco London is in a backwardation in early February for something like the fourth week in a row, but only loco London. The forward curve elsewhere is positive.
This is essentially Bank of England-vaulted gold and as most banks / finance houses don't have a direct relationship with the BoE or with the primary logistics houses it can currently take some weeks to get the metal out because it's allocated and they have to get the correct bars. Also – loco London bars are not deliverable against COMEX so the material is going into Switzerland for melting into the right size (100 ounces or kilo bars) and then onwards to the US.
That sets the scene for current developments in the markets; now we take a quick look at how volumes have traded over January.
GOLD –still uncertain, and taking cover ; spot prices
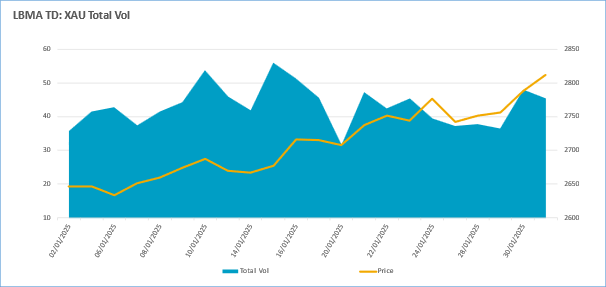
Overall volumes and spot price, January
 Source: LBMA
And over the year;
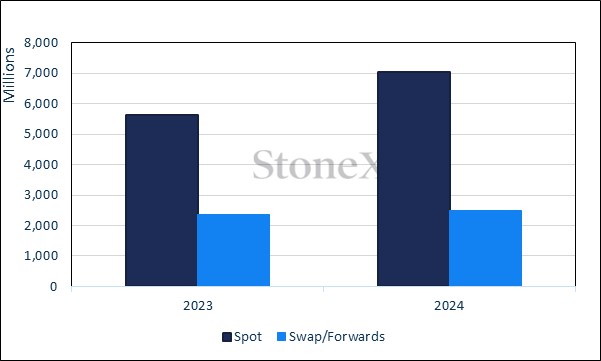

Source: LBMA, StoneX
-
Spot volume in gold was 5% higher in January than over the average for the whole of 2024, with volumes notably strong in mid-month as trading in the EFP built up with a view to shipping metal out into the United States. The increasing uncertainty over geopolitical risk kept prices buoyant and investor interest strong (no doubt including official sector activity) and by end-month gold was testing $2,800 - a level that gave way at the start of February as prices marched on towards $2,900.
-
EFP activity does not show up in COMEX numbers as it is a counterparty trade and is not cleared through the exchange. This is where these daily numbers are illuminating. Spot turnover on the 11th, at 44.5M ounces (1.383t) was the highest for a month.
-
This development is backed up by the changes in COMEX inventories. Typically it takes ten days for metal to leave London and arrive at COMEX warehouse (but as noted above, the demand for metal has now extended the waiting time) ; and COMEX inventories started to swell as of 20th December. The January numbers show an 85% increase in gold inventories on the Exchange since 19th December; last at 1,038t or 61% of Open interest.
Spot gold volumes (000 ounces) and COMEX inventories, t
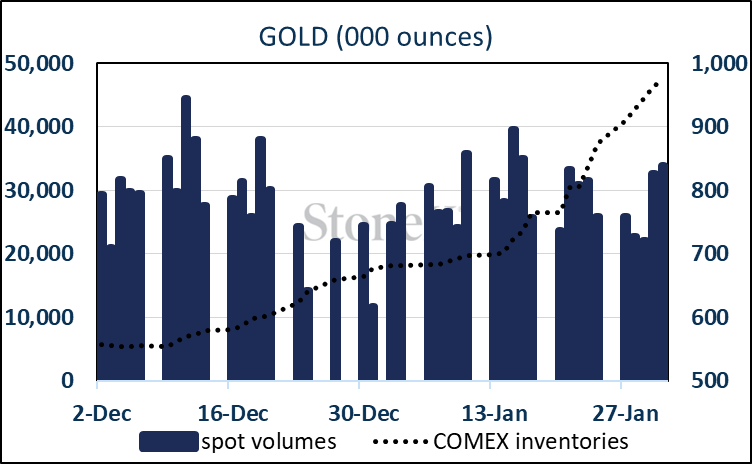
Source: LBMA, Bloomberg, StoneX
-
In the background, the month started slowly until volumes picked up smartly in the second week, when spot tested $2,700 on the 10th. Good two-way trading in all OTC sectors saw this attack repelled, but a week later, in increasing volume, that level was cleared as markets were at that point looking for renewed rate cuts from the Fed, especially as it was becoming clearer that a tariff-led regime has in the past led to slower growth.
-
Lively forward trading on the clearance of $2,700 stemmed the upward trend briefly, and volumes then fell back as prices rose towards $1,800, apart from lively LLD action after the first failure at $2,800. Spot volumes picked up smartly at month end, forcing a clearance of $2,800.
-
Meanwhile COMEX prices were rising to an increasing premium over loco London spot, which generated inflows from Asian centres into COMEX in order to take advantage of the arbitrage,
Gold technical pattern; one-year view
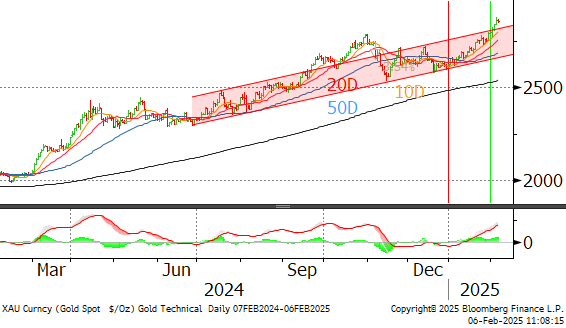
Source: Bloomberg, StoneX
ETFs: quiet, mixed over the month for a net gain of 18.0t. For the year as a whole, ETFs were flat following gains in the first half of the year and net redemptions in the second half. Regionally, Asia was the standout, with a 78t gain to 216t, an increase of 57%. Europe lost 180t while North America added just 8t.
CFTC: bullish tone overall, in line with market performance; outright longs started January at 567t and finished at 709t; shorts contracted sharply during the month but then expanded in the final week giving a net change drop from 64t to 54t.
Gold in local currencies, January 2024 to date
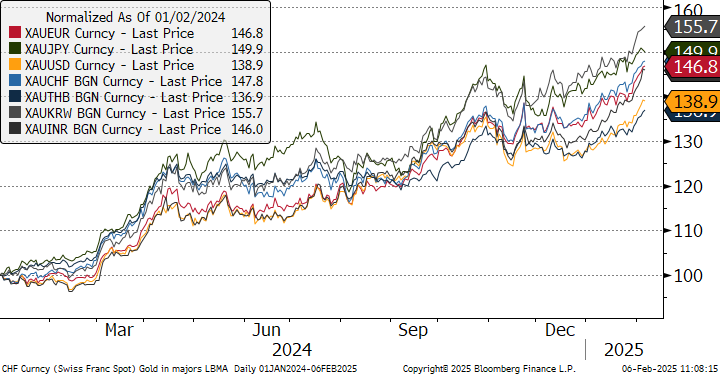
Source: Bloomberg, StoneX
SILVER; in tandem with gold but still shadowed by Europe, China economies
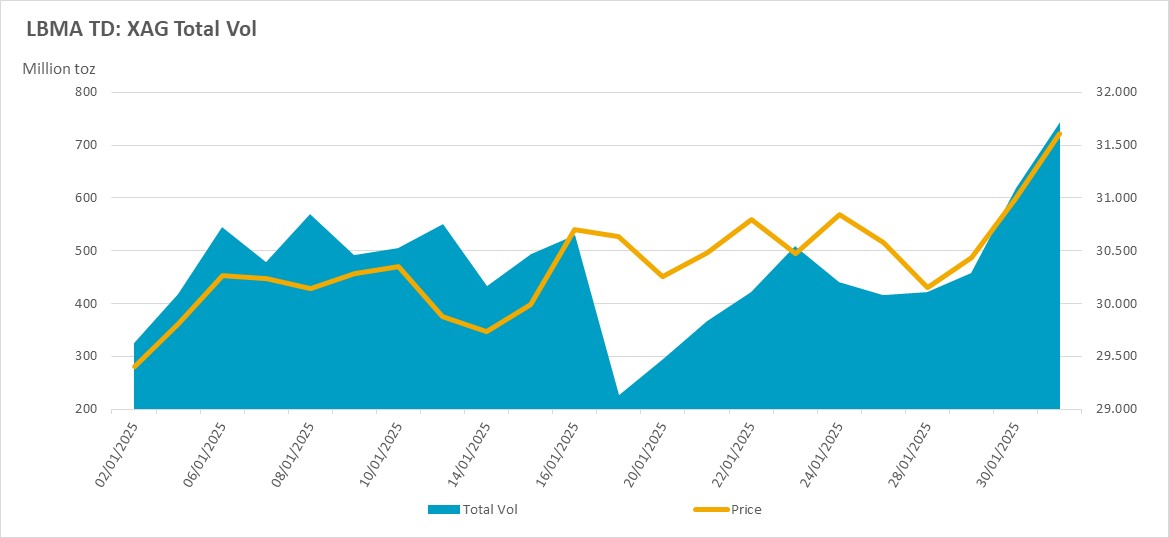
Source: LBMA
And for the year;
Source: LBMA, StoneX
-
The EFP story is similar for silver as it was for gold, although the percentage increase in COMEX inventories is a lot smaller as we write, at +17% against 85% for gold. Talk of a potential squeeze has abated, although silver, too, is in a small backwardation in London as stakeholders try to minimise nearby risk.
Total silver volumes and COMEX inventories, M ounces
Source: LBMA, Bloomberg, StoneX
-
Silver’s price action was again similar to gold, opening at $28.9 and closing at $31.3, a gain of 8.4% compared with gold’s net gain of 7.7%. This may seem counter-intuitive given that silver has a long history of higher volatility than gold, and that when gold makes a decisive move, silver’s amplitude is usually 2.0-2.5 times that of gold. This can largely be explained not just by the hype surrounding the EFP / COMEX activity, but also because silver is an industrial metal, with industrial demand commanding more than 60% market share, and the problems in Europe and China are casting a shadow over its more normal lustre.
-
Trading patterns were sporadic. Spot volumes were generally higher than in December, particularly in the early days when silver moved up through $30 and made a failed attempt at $30.5; a sharp reversal to $29.5 was in heavy volume, suggesting some stale bull liquidation, and following on from lively action in swaps/forwards and LLD, which also suggests that stakeholders didn’t expect much by way of gains and saw the $30+ level as a good opportunity to lock in prices.
-
There was healthy rebound, however with a swift run up to $31 and at this point volumes fell away as participants stood back, awaiting direction.
-
Gold’s continued improvement stimulated fresh gains and the market closed with a massive burst of activity in spot, with over a billion ounces (almost 32,000t) going through on spot in the final two days combined. Global mine production is roughly 26,000tpa.
ETFs; miked, but with heavier selling than buying for a net loss of 314t to 22,318t.
CFTC: longs rebounded to add 1,367t or 22%, while shorts also expanded, adding just over 1% to 3,223t for a net long of 4,280t.
Silver, gold and copper; the correlations and the gold:silver ratio, medium term
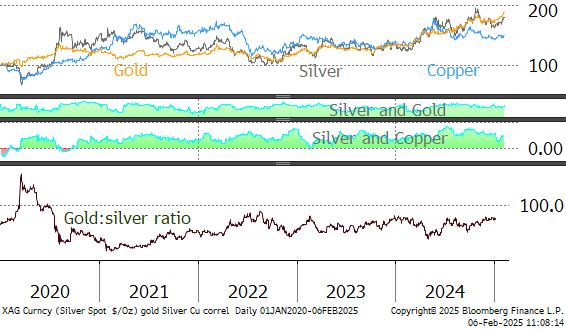
Source: Bloomberg, StoneX
Gold:silver ratio averaged 84.8 in 2024; in January it was .89.2
Silver’s correlation with gold averaged 0.80 in 2024 and 0.79 in December.
Silver’s correlation with copper was 0.54 in 2024 and 0.56 in January.
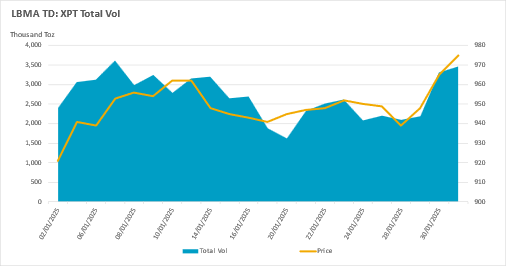
PLATINUM –bargain hunting into price weakness
Total platinum volumes, January, 000 ounces
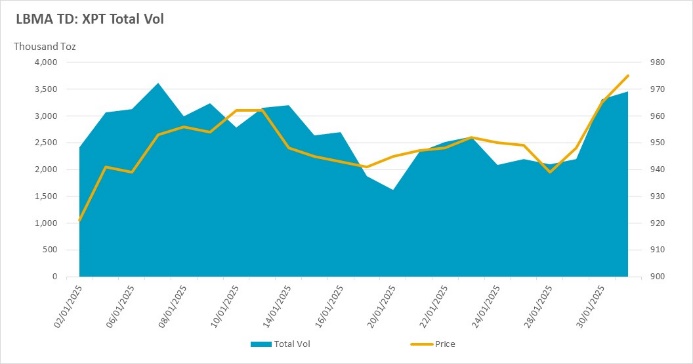
Source: LBMA
-
After spending two months on the defensive, dropping from a high of $1,056 in late October to $904 on 30th December, platinum unwound over 50% of that fall during January and went on to make further recovery in early February.
-
There was a sharp rally in the first ten days followed by a retracement and period of consolidation centred on $95 before further fresh gains at month-end, to close at $983.
-
The EFP story has been the most dramatic for platinum, but has failed to capture the headlines. Since early December NYMEX inventories have more than doubled, suggesting that autocat manufacturers and other industrial users are taking metal into the States in a hurry, particularly noting the rhetoric about South Africa that has come from President Trump, Elon Musk and now, in February, Secretary of State Rubio, who is refusing to attend the G20 in Johannesburg later this month.
Source: LBMA, Bloomberg, StoneX
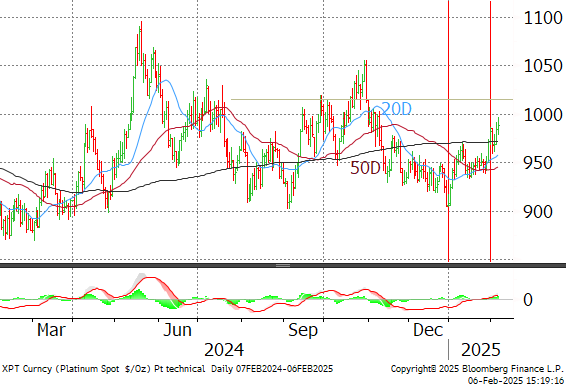
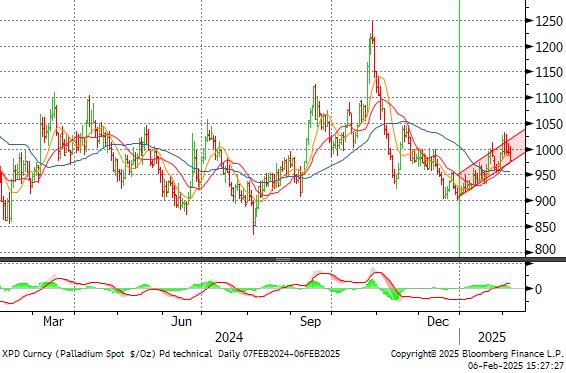
Platinum technical pattern, one-year view
Trading patterns
Part of this rally was driven by short covering, but part will also be related to possible concerns over any tightness developing in London, in the same way that it has for gold.
Spot volumes in January were 47% higher than the daily average for 2024, likely also reflecting the desire to get metal into the States. Swaps and forwards were 29% higher, notably in the first half of the month and especially when platinum crossed the $950 level - firstly to the upside, and then to the down, suggesting that this level was a target for inventory management. It was similar with LLD, and taking these two together suggests that initially, buyers may have taken the view that the market had turned. It also suggests that when the rally failed at the 200-day moving average this prompted some defensive forward selling.
Options were also busy in the first part of January, suggesting that the $1,000 strike was in view, and then again later in the month after support at $940 had held good and then again as spot pushed through $960.
ETFs: mixed interest with just eight days of net creations and redemptions notable during the period of downward correction. Net change over the month was a loss of 0.8t to 99.2t. Global mine production is ~170tpa.
CFTC: Big jump in longs at the start of the year, then long liquidation over the rest of the month, along with expanded shorts until the final week, when there was light short covering. Net change; from a short of -13t to a small long of 3.9t.
Platinum, palladium and the ratio, January 2016 to date,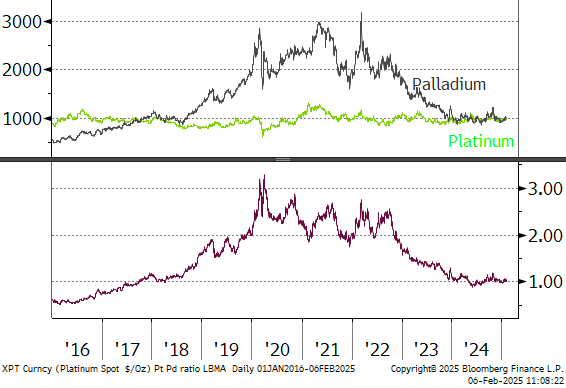
Source: Bloomberg, StoneX
PALLADIUM -specs remain bearish while ETFs expanded over the year
Palladium spot volumes, December, 000 ounces
Source: LBMA
After a brief period of consolidation in late December, following declines from highs of $1,248 in late October (post Sibanye-Stillwater restructuring announcement) palladium rallied steadily through January, with a mild correction mid-month. After opening at $904, palladium saw out the month with a sharp three-day rally that saw it challenge $1,000 and close at $996. The shift in inventory on CME in the other three metals was not echoed in palladium, with NYMEX inventories static until early February.
Spot volumes were 9% higher in January than the 2024 daily average, and, similarly to the other metals, the first half of the month was busier than the second, until the final day when volumes boomed and at 1.03M ounces (32t) were the highest since mid-November.
Patterns differed across the different sectors with options busier in mid-month, while swap/forwards were busy early, and then late in the month. LLD was very lively at the beginning and then faded, with a mild recovery towards month-end.
What this all suggests is as follows: -
Initially, some cautious bargain hunting in spot, which fizzled out in mid-month after a gain of $70, but without the strength to challenge the psychologically important $1,000. The early volume in swaps and forwards would tend to back this up, suggesting industrial buying and leasing activity. The perking up in the options markets coincided with the move between $920 and $980, and suggests that bullish stances were being taken and towards month-end, when prices surged forward in increasing volume it is possible that some of the increase in spot was delta hedging as $1,000 approached.
The mid-month retreat, which was relatively shallow, was in thin volumes across the board suggesting that the market as a whole was standing back and taking stock, and, for a short while at least, sentiment veered towards the bullish argument.
Palladium technical pattern, one year view
ETFs: Also mixed with an even number of days of creation and redemption. Here too, though, the sellers dominated for a monthly loss of 1.0t to 22.7t. Global mine production is ~190t.
CFTC: Longs were variable, rising, falling slightly and rising again for a net gain of one tonne to 10.8t; while the shorts were back in force, rising from 30t to 46t, with the biggest expansion in mid-month.
Spot platinum, palladium and the spread, January 2017 to date
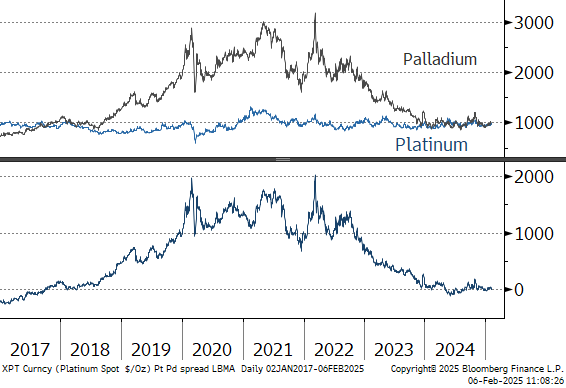
Source: Bloomberg, StoneX
The StoneX Group Inc. group of companies provides financial services worldwide through its subsidiaries, including physical commodities, securities, exchange-traded and over-the-counter derivatives, risk management, global payments and foreign exchange products in accordance with applicable law in the jurisdictions where services are provided. References to over-the-counter (“OTC”) products or swaps are made on behalf of StoneX Markets LLC (“SXM”), a member of the National Futures Association (“NFA”) and provisionally registered with the U.S. Commodity Futures Trading Commission (“CFTC”) as a swap dealer. SXM’s products are designed only for individuals or firms who qualify under CFTC rules as an ‘Eligible Contract Participant’ (“ECP”) and who have been accepted as customers of SXM. StoneX Financial Inc. (“SFI”) is a member of FINRA/NFA/SIPC and registered with the MSRB. SFI is registered with the U.S. Securities and Exchange Commission (“SEC”) as a Broker-Dealer and with the CFTC as a Futures Commission Merchant and Commodity Trading Adviser. References to securities trading are made on behalf of the BD Division of SFI and are intended only for an audience of institutional clients as defined by FINRA Rule 4512(c). References to exchange-traded futures and options are made on behalf of the FCM Division of SFI . StoneX is a trading name of StoneX Financial Ltd (“SFL”). SFL is registered in England and Wales, Company No. 5616586. SFL is authorized and regulated by the Financial Conduct Authority [FRN 446717] to provide to professional and eligible customers including: arrangement, execution and, where required, clearing derivative transactions in exchange traded futures and options. SFL is also authorised to engage in the arrangement and execution of transactions in certain OTC products, certain securities trading, precious metals trading and payment services to eligible customers. SFL is authorised & regulated by the Financial Conduct Authority under the Payment Services Regulations 2017 for the provision of payment services. SFL is a category 1 ring-dealing member of the London Metal Exchange. In addition SFL also engages in other physically delivered commodities business and other general business activities which are unregulated and not required to be authorised by the Financial Conduct Authority. StoneX Group Inc. acts as agent for SFL in New York with respect to its payments services business. StoneX APAC Pte. Ltd. acts as agent for SFL in Singapore with respect to its payments services business. ‘StoneX’ is the trade name used by StoneX Group Inc. and all its associated entities and subsidiaries.
Trading swaps and over-the-counter derivatives, exchange-traded derivatives and options and securities involves substantial risk and is not suitable for all investors. Past performance of any futures or option is not indicative of future success. Indicators are not a trading system and are not published as a specific trade recommendation. The information herein is not a recommendation to trade nor investment research or an offer to buy or sell any derivative or security. It does not take into account your particular investment objectives, financial situation or needs and does not create a binding obligation on any of the StoneX group of companies to enter into any transaction with you. You are advised to perform an independent investigation of any transaction to determine whether any transaction is suitable for you. No part of this material may be copied, photocopied or duplicated in any form by any means or redistributed without the prior written consent of StoneX Group Inc.
© 2025 StoneX Group Inc. All Rights Reserved.
Discover more insights