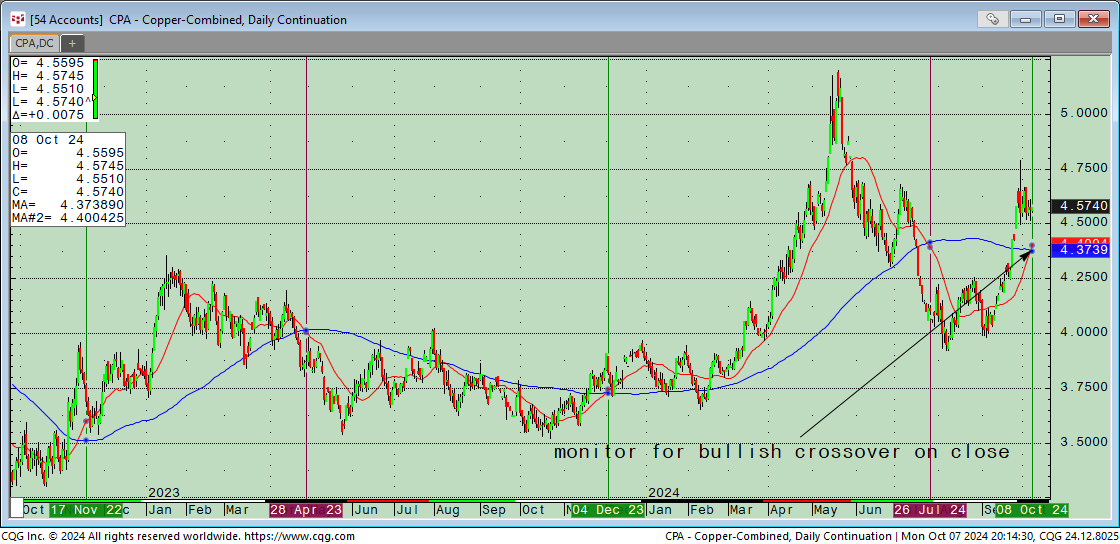
Copper: possible long term bull window
Continuation Chart in COMEX Copper: monitor for a bullish window via a positive crossover of the 20 day average (red line) above 100 day average (blue line). Prior similar bullish setups via green vertical lines, with bears in purple.

This material should be construed as the solicitation of an account, order, and/or services provided by the FCM Division of StoneX Financial Inc. (“SFI”) (NFA ID: 0476094) and represents the opinions and viewpoints of the author. It does not constitute an individualized recommendation or take into account the particular trading objectives, financial situations, or needs of individual customers. Additionally, this material should not be construed as research material. The trading of derivatives such as futures, options, and over-the-counter (OTC) products or “swaps” may not be suitable for all investors. Derivatives trading involves substantial risk of loss, and you should fully understand the risks prior to trading. Past results are not necessarily indicative of future results.
All references to futures and options on futures trading are made solely on behalf of SFI.
SFI is not responsible for any redistribution of this material by third parties, or any trading decisions taken by persons not intended to view this material. Information contained herein was obtained from sources believed to be reliable, but is not guaranteed as to its accuracy. Contact designated personnel from SFI for specific trading advice to meet your trading preferences.
Reproduction or use in any format without authorization is forbidden.
© Copyright 2024. All rights reserved.


