US GPD Growth
US GPD growth
US GDP growth is a measure of the change in the gross domestic product (GDP) of the United States. It's often used by economists to determine the health of its economy and at what rate the economy is growing.
Economic reports often include the year over year (YoY) change, referred to as the GDP growth rate, alongside the GDP growth figure to provide more context.
What is GDP Growth?
GDP growth measures the change in GDP from one period to the next, often year-over-year. GDP, which stands for gross domestic product, is a measure of the total market value of a country's output of goods and services produced within its borders. The growth rate is used by economists to gauge whether an economy is speeding up or slowing down.
How is GDP Growth Reported?
GDP growth is reported every quarter by the Bureau of Economic Analysis, but within those financial quarters estimates of GDP will be revised twice as more data is collated and analyzed. For this reason, a new GDP Growth figure is reported every month.
The monthly GDP reports for each quarter are referred to as:
- Advance estimate
- Second estimate
- Third estimate
The advance estimate, which is reported first, often has the largest impact on economic markets, as the second and third estimates are usually minor revisions to the initial report. The second and third GDP figures will be termed "upward" or "downward" revisions depending on whether the estimates are greater or less than the initial figure.
How is GDP Growth Measured?
GDP Growth is measured as a percent change from the same quarter of the previous year. It may be reported as quarter-on-quarter (QoQ) or year-on-year (YoY), and sometimes at an annual rate. When reported as year-over-year, economists are usually comparing new GDP figures with GDP growth from the same quarter in the year prior.
Tracking GDP in quarters is helpful to prevent seasonal differences in production from skewing the growth rate. For example, fourth quarter GDP receives a boost from employees receiving seasonal bonuses compared to third quarter figures. By comparing the latest fourth quarter rate with the year prior, economists derive a more accurate picture of growth. Seasonal trends of economic indicators like employment and gross exports are also why GDP is compared quarter on quarter.
GDP Growth is comprised of four figures: consumer spending (consumption), residential investment, government spending, and net exports. Measured together by the US Bureau of Economic Analysis, adjustments are made
Components of GDP
GDP is measured as a combination of four figures of economic activity which altogether place a price tag on the productive output of the US economy.
Consumer Spending
Consumer spending, or personal consumption expenditures, is the purchase of goods and services by private households. On average these purchases account for two-thirds of the entire gross domestic product.
The activity of everyday consumers can be predicted by the release of other economic data before GDP reports are released such as consumer credit, retail sales, and unemployment.
Investment
Investment refers to expenditures by private businesses of capital goods such as real estate and business equipment. Despite the name, the category has nothing to do with the purchase and trade of financial assets. Investment is better thought of as the same transactions measured in consumer spending, except these are carried out by large private entities.
Government Spending
Government spending accounts for all purchases of goods and services by federal, state, and local governments. This includes employee payroll and infrastructure spending, but not transfer payments and interest on debt.
When GDP growth is low due to declines in consumer spending and investment, the federal government may increase its spending to boost the economy with monetary policy like quantitative easing. During these times, government spending becomes a larger percentage of overall GDP.
Net Exports
Net exports refer to the national income of international trade, calculated by subtracting the cost of imports from revenue by exports. Unlike the other three elements of GDP, net exports can be positive or negative.
This figure is where international policy currency impacts total GDP. Inflation levels, exchange rates, energy prices, and international trade policy all have the ability to make net exports negative or positive.
Real vs Nominal GDP
Both real and nominal gross domestic product hold significance as economic indicators. Real GDP is often the more prominent figure, as economists use this to track the rate of growth while taking inflation into account. It allows for a more accurate measure of the data from one period to the next.
Nominal GDP, which is unadjusted for inflation, also has its uses. This more straightforward calculation is used by economists to point to the total purchasing power of US consumers. It is a straightforward, current snapshot of the economy, and in periods of low inflation will be closely aligned with real gross domestic product.
How to Analyze GDP Growth
GDP Growth is a key economic indicator because of its implications for the US economy as a whole. Investors and traders use GDP growth to estimate future monetary policy.
For example, a recession is marked by two consecutive quarters of negative GDP growth. Even just stagnant GDP growth will propel the Federal Reserve to shift central bank policy into dovish territory. Central banks will lower interest rates and increase government spending all in an attempt to create positive GDP growth.
If the figure is too high, central banks will also look to pull back growth to avoid possible runaway inflation. Typically, the Fed will raise interest rates and reduce government spending as a response.
FAQs:
What is the GDP Growth Rate in 2024?
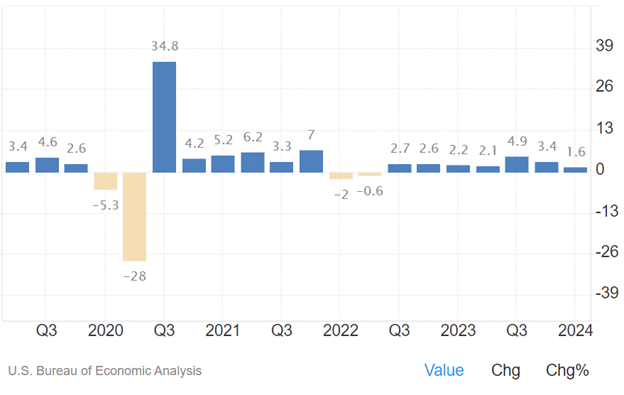
According to advance estimates from the US Bureau of Economic Analysis, real GDP growth increased at an annual rate of 1.6% in the first quarter of 2024.
What is the GDP Growth for the Last 5 Years?
With the exception of a significant dip in 2020, US real GDP has grown at an average rate of 2.2% over the past five years.

Which Country's GDP is Highest in the World?
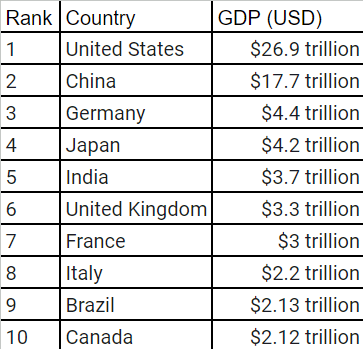
The United States has the highest GDP per country in the world, significantly higher than even the second-place country, China. See the top ten country GDPs reported by the International Monetary Fund World Economic Outlook database in October 2023.

What Does the Yield Curve Tell Us About GDP Growth?
The yield curve measures the spread of yields between short and long-term bonds. Economists identify a relationship between this measurement and GDP growth to predict future recessions. When the yield on short-term treasuries rises above that of long-term treasuries, the yield curve inverts and signals that GDP growth is swinging into negative territory.
This material should be construed as market commentary and represents the opinions and viewpoints of the author, and does not reflect tailored advice associated with any specific account of the FCM Division of StoneX Financial Inc. ("SFI") (NFA ID: 0476094) or StoneX Markets LLC ("SXM") (NFA ID: 0449652). The information herein is not advice nor a recommendation to trade nor an offer to buy or sell any financial product or service. Additionally, this material should not be construed as research material. The trading of derivatives such as futures, options, and over-the-counter (OTC) products or “swaps” may not be suitable for all investors. Derivatives trading involves substantial risk of loss, and you should fully understand the risks prior to trading. Past results are not necessarily indicative of future results.
All references to and discussion of OTC products or swaps are made solely on behalf of SXM. All references to futures and options on futures trading are made solely on behalf of SFI. SXM products are intended to be traded only by individuals or firms who qualify under CFTC rules as an ‘Eligible Contract Participant’ (“ECP”) and who have been accepted as customers of SXM.
SFI and SXM are not responsible for any redistribution of this material by third parties, or any trading decisions taken by persons not intended to view this material. Information contained herein was obtained from sources believed to be reliable, but is not guaranteed as to its accuracy. Contact designated personnel from SFI or SXM for specific trading advice to meet your trading preferences.
Reproduction or use in any format without authorization is forbidden. © Copyright 2024. All rights reserved.
© 2025 StoneX Group Inc. all rights reserved.
The subsidiaries of StoneX Group Inc. provide financial products and services, including, but not limited to, physical commodities, securities, clearing, global payments, risk management, asset management, foreign exchange, and exchange-traded and over-the-counter derivatives. These financial products and services are offered in accordance with the applicable laws in the jurisdictions in which they are provided and are subject to specific terms, conditions, and restrictions contained in the terms of business applicable to each such offering. Not all products and services are available in all countries. The products and services offered by the StoneX Group of companies involve risk of loss and may not be suitable for all investors. Full Disclaimer.
This website is not intended for residents of any particular country, and the information herein is not advice nor a recommendation to trade nor does it constitute an offer or solicitation to buy or sell any financial product or service, by any person or entity in any jurisdiction or country where such distribution or use would be contrary to local law or regulation. Please refer to the Regulatory Disclosure section for entity-specific disclosures.
No part of this material may be copied, photocopied or duplicated in any form by any means or redistributed without the prior written consent of StoneX Group Inc. The information herein is provided for informational purposes only. This information is provided on an ‘as-is’ basis and may contain statements and opinions of the StoneX Group of companies as well as excerpts and/or information from public sources and third parties and no warranty, whether express or implied, is given as to its completeness or accuracy. Each company within the StoneX Group of companies (on its own behalf and on behalf of its directors, employees and agents) disclaims any and all liability as well as any third-party claim that may arise from the accuracy and/or completeness of the information detailed herein, as well as the use of or reliance on this information by the recipient, any member of its group or any third party.
